
Deployment Guide


7. Click Yes to display the graphs.
8. When you close a graph, a dialog box asks if you want to save the monitor.
If you click OK, the monitor is saved, and persists if the switch is restarted.
Creating the SCSI vs. IP Traffic graph
The SCSI vs. IP Traffic graph displays the SCSI versus IP traffic for selected ports. For Brocade DCX
8510-8, Brocade DCX 8510-4, and Brocade DCX and Brocade DCX 4S enterprise-class platforms, the
slot and port name are identified in the graph.
In a trunk group, the SCSI vs. IP Traffic graph displays only the master port and not the slave ports.
To create a SCSI vs. IP Traffic graph, perform the following steps.
1. Open the Performance Monitor window.
2. Select Performance Graphs > Advanced Monitoring > SCSI vs. IP Traffic.
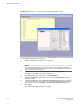
The SCSI vs. IP Traffic Setup dialog box displays. This dialog box is similar to that shown in Figure
23 on page 132.
3. Double-click the domain to expand the slot/port list.
NOTE
For the Brocade DCX 8510-8, Brocade DCX 8510-4, and Brocade DCX and Brocade DCX-4S
enterprise-class platforms, click the plus sign (+) to expand the ports under each slot, as shown in
Figure 23 on page 132.
4. Click the port you want to monitor in the graph in the Port Selection List. Use Shift + click and Ctrl
+ click to select multiple ports.
5. Click Add to move the selected ports to the Selected Ports list.
6. Optional: Click ADD ALL Ports to add all of the ports in the Port Selection List to the Selected
Ports list.
7. Optional : Click Search to open the Search Port Selection List dialog box, from which you can
search for all E_Ports, all F_Ports, or all port names with a defined string. Select the ports you want
to add and click Search in the Search Port Selection List dialog box.
8. Click Apply in the SCSI vs. IP Traffic Setup dialog box.
Only the selected ports are displayed in the SCSI vs. IP Traffic graph.
Creating SCSI command graphs
This graph displays the total number of read or write (or both) commands on a given port or to a
specific LUN on a given port.
To create a SCSI command graph, perform the following steps.
1. Open the Performance Monitor window.
2. Select Performance Graphs > Advanced Monitoring > SCSI Commands > Graph Type.
The applicable setup dialog box displays.
3. Navigate to a switch > slot > port in the Port Selection List .
4. Click the port from the Port Selection List and drag it into the Enter/drag port field.
5. Optional: For the LUN per port graphs, enter a LUN number, in hexadecimal notation.
Creating the SCSI vs. IP Traffic graph
134 Web Tools Administrator's Guide
53-1003169-01