
Administrator Guide

94 Web Tools Administrator’s Guide
53-1002756-01
Opening the Performance Monitor window
7
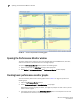
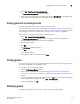
FIGURE 22 Canvas of six performance monitoring graphs
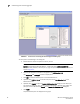
Opening the Performance Monitor window
To perform performance monitoring, you must use Web Tools with the EGM license; otherwise,
access to this feature is denied and an error messages displays.
To open the Performance Monitor window, perform the following steps.
1. Select a switch from the Fabric Tree and log in when prompted.
2. Click Monitor > Performance Monitor. The Performance Monitor window displays.
Creating basic performance monitor graphs
To create the basic performance monitor graphs listed in Table 11 on page 91, perform the
following steps.
1. Open the Performance Monitor window.
2. Select Performance Graphs > Basic Monitoring > Graph Type.
Depending on the type of graph you select, you might be prompted to select a slot or port for
which to create a graph.
3. If prompted, drag the port into the Enter/drag slot,port field, or manually enter the slot and
port information in the field, in the format slot,port.