
Administrator Guide
Web Tools Administrator’s Guide 99
53-1002756-01
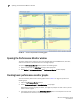
Tunnel and TCP performance monitoring graphs
7
3. Navigate to a switch > slot > port in the Port Selection List.
4. Click the port from the Port Selection List and drag it into the Enter/drag port field.
5. Optional: For the LUN per port graphs, enter a LUN number, in hexadecimal notation.
For the Brocade Encryption Switch, you can enter up to eight LUN masks
For the Brocade 5100, 5300, 300, 7800, and 8000, you can enter up to eight LUN masks
For all other switches running Fabric OS 4.x or v5.x, you can enter up to two LUN masks.
For switches running Fabric OS 3.x, you can enter up to three LUN masks.
6. Click OK.
The selected graph displays in the canvas.
Tunnel and TCP performance monitoring graphs
This section describes how to generate the Tunnel and TCP performance monitor graphs. You can
launch maximum of four Tunnel and TCP graphs for a switch at a time. A total of 16 TCP connection
graphs can be launched for a switch.
The TCP graphs available are:
• Sender RoundTrip
• Sender RoundTripVariance
• TCP DupAck
• TCP OOS
• TCP SlowStart
• TCP FastRetransmit
• TCP Tx(MB/sec)
• TCP Rx(MB/sec)
The Tunnel graphs available are:
• Throughput(MB/sec)
• Effective Throughput(MB/sec)
• CompressionRatio
For TCP connection graphs, tool tip is displayed only for all selected connections.
To create a Tunnel and TCP graph, perform the following steps.
1. Select Monitor > Performance Monitor.
The Performance Monitor window displays.
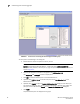
2. Select Performance Graphs > Tunnel and TCP Graph.
The Tunnel and TCP Graph dialog box displays.
3. Select the tunnel from the Tunnels drop-down list for which you want to generate the graphs.
For Brocade 7800 extension switch, you can have maximum six circuit connections in a tunnel
and for FX8-24 DCX extension blade, you can have maximum of ten circuit connections in a
tunnel.