
Deployment Guide
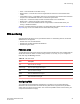
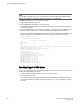

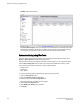

FIGURE 7 Fabric Watch Window
The Fabric Watch Explorer pane on the left side of the window displays the available classes. Not
all classes are available for all switches. The status bar at the bottom of the window provides you
with a summary of recent actions, and the date and time the module was last updated.
System monitoring using Web Tools
The Fabric Watch license must be installed to view and modify the System Monitor details. Select
Monitor > System Monitor to display the System Monitor.
When the switch exceeds the configured usage limit, an alarm triggers. You can configure the alarm
with the Alarm Configuration tab. The alarm can be configured for SNMP trap, RAS log, or both.
There are three trait and alarm configuration values for System Monitor:
• Polling Interval
• Usage Limit
• No. of Retries
To configure the usage limits for System Monitor, perform the following steps.
1. Open the Fabric Watch window.
2. Select either Memory Usage or CPU usage.
3. Modify the values in the Trait Configuration tab.
When these values are exceeded, the alarm triggers.
4. Click the Alarm Configuration tab.
5. Select SNMP Trap, RAS log, or both options.
6. Click Apply.
System monitoring using Web Tools
100 Fabric Watch Administrators Guide
53-1003142-01