
Deployment Guide

Displaying the current memory usage threshold
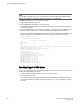
To display the current memory usage threshold, enter the sysMonitor --show mem command.
switch:admin> sysmonitor --show mem
Used Memory: 171476k 34%
Total Memory: 504344k
Free Memory: 332868k
Used Memory Limit: 60%
Low Used Memory Limit: 40%
High Used Memory Limit: 70%
Polling Interval: 10 seconds
No Of Retries: 1
Actions: snmp,raslog
Configuring the system memory usage monitoring threshold
Enter the sysMonitor command using the following parameters:
switch:admin> sysmonitor --config mem -poll 10 -retry 1 -limit 20 -action snmp,
raslog -high_limit 80
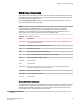
Recommended environment and resource monitoring settings
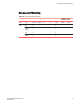
Recommended Environment and Resource class settingsTABLE 27
E=Error_Log, S=SNMP_Trap,
P=Port_LOG_LOCK,
M=EMAIL_ALERT, PF=Port
Fence
Trait Configuration
Class Area Default Custom Unit Time Base Low
Thresh
High
Thresh
Buffer Default Custom Below Above
Environment Temperature X C None 0 Depends
on switch
type
10 X E, S E, S
Resource Flash X Percentage None 0 90 0 X E, S E, S
Switch monitoring
Before entering the switchStatusPolicySet command, plan your switch status policy. Determine your
system requirements and the factors that affect its monitors.
NOTE
Based on the configuration of the core blade component of the switch status policy, Fabric Watch
generates two RASlogs when a core blade is removed either on the Brocade DCX or the Brocade
DCX-4S. For example, if the Down and Marginal configuration is 0 and 1 on the DCX, upon removal of
the first core blade, Fabric Watch generates one RASLog for the switch status policy and the other
RASLog for the error itself.
Displaying the current memory usage threshold
92 Fabric Watch Administrators Guide
53-1003142-01