
Deployment Guide


Fabric OS Command Reference 1147
53-1003131-01
sysMonitor
2
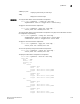
To pause monitoring of the resources class for a single element:
switch:admin> sysmonitor --pause resource -area all -index 0
switch:admin> sysmonitor --show resource -current
Class |Area |Index |Value |State |Monitoring
---------|-------|------|---------|-------|--------------
RESOURCE |FLASH |000000|78 |InRange|Pause
To continue monitoring of the resources class:
switch:admin> sysmonitor --continue resource -area all -index 0
switch:admin> sysmonitor --show resource -current
Class |Area |Index |Value |State |Monitoring
---------|-------|------|---------|-------|--------------
RESOURCE |FLASH |000000|78 |InRange|Continue
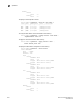
To configure the thresholds for memory usage monitoring:
switch:admin> sysmonitor --config mem -poll 10 -retry 3 \
-limit 60 -action snmp,raslog \
-high_limit 70 -low_limit -40
To display the current memory usage and configuration:
switch:admin> sysmonitor --show mem
Showing Memory Usage:
Used Memory : 192020k 25%
Total Memory : 768080k
Free Memory : 576060k
Used Memory Limit : 60%
Low Used Memory Limit : 40%
High Used Memory Limit: 70%
Polling Interval : 60 seconds
No Of Retries : 3
Actions : none
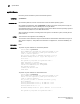
To configure the threshold for monitoring system CPU usage:
switch:admin> sysmonitor --config cpu -poll 20 -retry 4 \
-limit 70 -action snmp
To display the current memory usage threshold:
switch:admin> sysmonitor --show cpu
Showing Cpu Usage:
Cpu Usage : 21.9%
Cpu Usage limit : 75%
Number of Retries : 4
Polling Interval : 120 seconds
Actions : none
SEE ALSO fwHelp, portFencing, portThConfig, thConfig