
Deployment Guide


NOTE
No existing bottleneck daemon logic or behaviors have been removed from Fabric OS 7.3.0.
Enabling MAPS Fabric Performance Impact monitoring
NOTE
If you want to use MAPS Fabric Performance Impact (FPI) monitoring, the legacy bottleneck
monitoring feature cannot be enabled.
Use the following steps to enable MAPS FPI monitoring. This is not necessary on new switches
already running Fabric OS 7.3.0, or if the legacy bottleneck monitoring feature was not enabled before
the switch firmware was upgraded to Fabric OS 7.3.0, as FPI is automatically enabled by MAPS.
1. Connect to the switch and log in using an account with admin permissions.
2. Enter mapsConfig --enableFPImon.
• If the legacy bottleneck monitoring feature is enabled, you will see the following message:
Operation failed. Bottleneck monitoring is enabled. Please disable bottleneck
monitoring and retry.
• If the legacy bottleneck monitoring feature is not enabled, you will see the following message:
Error: MAPS Fabric Performance Impact monitoring is enabled
To disable MAPS FPI monitoring, enter mapsConfig --disableFPImon.
For more information on the relationship of MAPS FPI monitoring and the
legacy bottleneck monitoring feature, refer to MAPS Fabric Performance Impact
monitoring and legacy bottleneck monitoring on page 88.
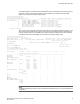
Bottleneck detection with the MAPS dashboard
Bottleneck monitoring based on the Fabric OS bottleneck daemon is integrated with the MAPS
dashboard, enabling you to easily see which ports are impacted by either persistent or transient
bottlenecks.
The MAPS dashboard displays the following latency events:
• Latency bottlenecks on any port
• Timeouts occurring on any 16 Gbps-capable Fibre Channel platform port
• A stuck Virtual Channel on any port
• Congestion bottleneck events (backpressure) on individual F_Ports (not F_Port trunks)
The MAPS dashboard identifies the ports on which bottlenecks are seen and sorts them based on the
number of seconds that they exceeded the bottleneck threshold. This identifies the most strongly
affected ports, no matter what the cause.
The bottleneck information appears in the “Rules Affecting Health” section as part of the Port Health
category, and includes bottleneck events detected by the bottleneck daemon. However, even if the
bottleneck daemon does not log a bottleneck event (due to lack of persistence), the data shown in the
“History Data” section displays entries both for those ports that have bottlenecks detected by the
daemon and for those ports that have cred_zero counters that are not zero. If the cred_zero counter
increases for a port but no bottleneck time is recorded, this indicates a potential transient bottleneck
on the port.
Enabling MAPS Fabric Performance Impact monitoring
86 Monitoring and Alerting Policy Suite Administrator's Guide
53-1003147-01