
Users Guide


Fabric Watch Administrator’s Guide 41
53-1002998-01
Performance monitoring guidelines and default settings
6
Performance monitoring guidelines and default settings
Performance monitoring serves as a tuning tool. The Performance Monitor class groups areas that
track the source and destination of traffic. Use the Performance Monitor class thresholds and
alarms to determine traffic load and flow and to reallocate resources appropriately.
NOTE
Performance Monitoring is not supported on VE_Ports.
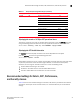
Performance Monitor class areas
Table 9 lists Product Name areas in the Performance Monitor class and describes each area.
Although it is recommended that you leave the entire Performance Monitor class in its default state
(no alerts), you can configure the Performance class using the thConfig command.
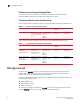
Transmit power
(TXP)
Monitors transmit
power in µWatts
Unit: µWatts
Time Base: none
Low: 0
High: 5000
Buffer: 25
Below: 1
Above: 1
Out_of_range
Out_of_range
Current Monitors SFP current Unit: mA
Time Base: none
Low: 0
High: 50
Buffer: 1
Below: 1
Above: 1
Out_of_range
Out_of_range
Voltage Monitors SFP
electrical force in
volts
Unit: mV
Time Base: none
Low: 2970
High: 3630
Buffer: 10
Below: 1
Above: 1
Out_of_range
Out_of_range
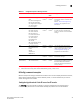
Power on hours Monitors the number
of hours the 16 Gbps
SFP is powered on.
Unit: Changes
Time Base: none
Low: 0
High: 0
Buffer: 0
Below: 0
Above: 0
Informative
Informative
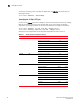
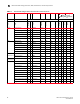
TABLE 8 SFP class default settings (Continued)
Area Description Default threshold settings Default alarm
settings
Threshold state
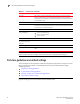
TABLE 9 Performance Monitor class areas
Area Description
RXP
(EE performance monitor)
The percentage of word frames traveling from the configured S_ID to the D_ID exceeds
the configured thresholds.
TXP
(EE performance monitor)
The percentage of word frames traveling from the configured D_ID to the S_ID; user
configuration triggers these messages, so you can use the Transmit Performance area
to tune your network.