
Users Guide

42 Fabric Watch Administrator’s Guide
53-1002998-01
thConfig command
6
Performance monitoring setting guidelines
It is recommended that you leave the entire Performance Monitor Class and End-to-End
Performance Monitor Class area settings in their default state (no alerts).
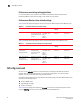
Performance Monitor class default settings
Table 10 provides default settings for areas in the Customer-Defined Performance Monitor class.
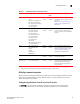
Table 11 provides default settings for areas in the End-to-End Performance Monitor class.
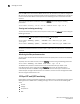
thConfig command
You can use the thConfig command to customize event monitoring thresholds for the Fabric,
Security, SFP, and Performance classes, or to display the configuration. It is recommended,
however, that you use the default settings for these classes.
If configured areas exceed the currently-effective threshold settings, the Fabric Watch daemon can
take one of the following actions:
• Send an SNMP alarm.
• Log a RASlog message.
• Send an e-mail alert.
Table 12 lists the configuration options for thConfig command. For complete information about
using the thConfig command, refer to the Fabric OS Command Reference.
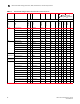
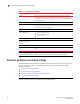
TABLE 10 Performance Monitor class default settings
Area Description Default threshold settings Default alarm
settings
Threshold state
Customer-defined filter Monitors the number
of frames per second
that are filtered out by
the port
Unit: Frames
Time Base: none
Low: 0
High: 0
Buffer: 0
Below: 0
Above: 0
Informative
Informative
TABLE 11 End-to-End Performance Monitor class default settings
Area Description Default threshold settings Default alarm
settings
Threshold state
End-to-end receive
performance
(RX performance)
Monitors the
receiving traffic
between a SID_DID
pair in a port
Unit: KBps
Time Base: none
Low: 0
High: 0
Buffer: 0
Below: 0
Above: 0
Informative
Informative
End-to-end transmit
performance
(TX performance)
Monitors the transmit
traffic between a
SID_DID pair in a port
Unit: KBps
Time Base: none
Low: 0
High: 0
Buffer: 0
Below: 0
Above: 0
Informative
Informative