
Administrator Guide


Fabric Watch Administrator’s Guide 97
53-1002752-01
Chapter
10
Fabric Watch Reports
In this chapter
•Fabric Watch reports . . . . . . . . . . . . . . . . . . . . . . . . . . . . . . . . . . . . . . . . . . . . 97
•Switch Availability Monitor report . . . . . . . . . . . . . . . . . . . . . . . . . . . . . . . . . . 98
•Switch Health report . . . . . . . . . . . . . . . . . . . . . . . . . . . . . . . . . . . . . . . . . . . . 99
•Switch Status Policy report . . . . . . . . . . . . . . . . . . . . . . . . . . . . . . . . . . . . . . 100
•Port Detail report . . . . . . . . . . . . . . . . . . . . . . . . . . . . . . . . . . . . . . . . . . . . . . 101
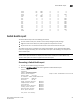
Fabric Watch reports
You can run reporting commands in Fabric Watch to get instant access to switch information.
Although the switchShow command provides basic switch information, the Fabric Watch reports
provide detailed information, which enables you to track marginal or faulty ports that can affect
throughput or switch performance.
You can generate reports from the command line using a Telnet session or by using Web Tools. The
examples in this chapter use the command line interface.
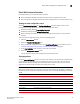
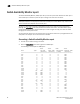
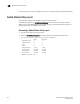
Table 32 lists the Fabric OS commands to view reports.
You can generate the following types of reports using Fabric Watch:
• Switch Availability Monitor report
• Switch Health report
• Switch Status Policy report
• Port Detail report
TABLE 32 Fabric OS commands to view Fabric Watch reports
Command Displays
fwSamShow Port failure rate report
switchStatusShow Switch health report
switchStatusPolicyShow Switch status policy report
fwPortDetailShow
fwPortDetailShow --s h
fwPortDetailShow --s m
fwPortDetailShow --s f
fwPortDetailShow --s o
Port detail report
To view only health ports
To view only marginal ports
To view only faulty ports
To view only offline ports