
Deployment Guide

For the Brocade Encryption Switch, you can enter up to eight LUN masks For the Brocade 5100,
5300, 300, and 7800, you can enter up to eight LUN masks.
6. Click OK.
The selected graph displays in the canvas.
Tunnel and TCP performance monitoring graphs
This section describes how to generate the Tunnel and TCP performance monitor graphs. You can
launch a maximum of four Tunnel and TCP graphs for a switch at a time. A total of 16 TCP connection
graphs can be launched for a switch.
The TCP graphs available are:
• Sender RoundTrip
• Sender RoundTripVariance
• TCP DupAck
• TCP OOS
• TCP SlowStart
• TCP FastRetransmit
• TCP Tx(MB/sec)
• TCP Rx(MB/sec)
The Tunnel graphs available are:
• Throughput(MB/sec)
• Effective Throughput(MB/sec)
• CompressionRatio
For TCP connection graphs, tool tips are displayed only for all selected connections.
To create a Tunnel and TCP graph, perform the following steps.
1. Select Monitor > Performance Monitor.
The Performance Monitor window displays.
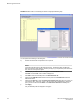
2. Select Performance Graphs > Tunnel and TCP Graph .
The Tunnel and TCP Graph dialog box displays.
3. Select the tunnel from the Tunnels list for which you want to generate the graphs.
For the Brocade 7800 Extension Switch, you can have a maximum of six circuit connections in a
tunnel, and for the Brocade 7840 Extension Switch, you can have a maximum of four circuit
connections in a tunnel, and for the FX8-24 extension blade, you can have a maximum of ten circuit
connections in a tunnel.
4. In the Tunnel and TCP area at the bottom of the window, select the required check boxes for the
statistic you want to graph.
Note that each column represents a different graph.
5. Click Options to set the display options for the graphs.
Tunnel and TCP performance monitoring graphs
Web Tools Administrator's Guide 135
53-1003169-01