
Deployment Guide


• Range: The range is from 3 through 30 seconds. The X axis is limited to 30 minutes. The graph
scale starts with 0 minutes and auto-scales to draw the statistics. Once the 30 minutes graph is
drawn, the first minute data is removed to accommodate the 31st minute values.
• Global auto scaling: By default, this option is in disabled mode. You can either enable or
disable this option. If enabled, the graph's X-axis scales up to 30 minutes and if it is disabled, the
X-axis will scale up to 10 minutes
• Number of graphs per row: Designate how many graphs you wish to appear in each row.
6. Click Generate.
7. Click Reset to reset all the graphs.
NOTE
Brocade Network Advisor has an option for launching the Tunnel and TCP Graph dialog box from
FCIP Tunnels dialog.
Tunnel and TCP graph chart properties
When a Tunnel and TCP graph displays, you can right-click the graph to access the display properties.
These properties include:
• Font selection
• Background color selection
• Title text
• Display zoom
These value selections are not persistent. When you close the graph, these values reset to the default
settings.
In addition, you can print the graph and save the graph to a file.
Saving graphs to a canvas
Saving graphs is useful when you create customized graphs and do not want to recreate them each
time you access the Performance Monitor window. When you save graphs, you must save them to a
canvas.
The following procedure describes how to save graphs to a new canvas.
1. Open the Performance Monitor window.
2. Create basic or advanced Performance Monitor graphs, as described in Creating basic performance
monitor graphs on page 130 and Advanced performance monitoring graphs on page 133.
The graphs display in the Performance Monitor window.
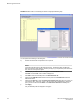
3. Select File > Save Current Canvas Configuration.
The Save Canvas Configuration dialog box displays.
4. Enter a name and description for the configuration and click Save Canvas. A message displays,
confirming that the configuration was successfully saved to the switch.
Tunnel and TCP graph chart properties
136 Web Tools Administrator's Guide
53-1003169-01