
Users Guide
44 Monitoring and Alerting Policy Suite Administrator’s Guide
53-1002933-02
MAPS dashboard overview
6
LF -------
LOSS_SIGNAL(LOS) -------
PE(Errors)-------
STATE_CHG -------
LR -------
C3TXTO(Timeouts) -------
RX(%) -------
TX(%) -------
UTIL(%) -------
BN_SECS(Seconds) -------
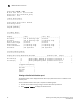
Viewing historical data
Entering mapsDb --show history displays a summarized history of the switch status since the
previous midnight. This is useful if you want a quick view of what has been happening on the switch
in that period. The output of this command differs depending on the platform you run it on. On
fixed-port switches, ports are shown in port index format; on chassis-based platforms, ports are
shown in slot/port format.
To view a summarized history of the switch status, complete the following steps.
1. Connect to the switch and log in using an account with admin permissions.
2. Run mapsDb --show history.
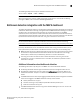
The following example displays all stored historical port performance data for a fixed-port switch.
switch:admin> mapsdb --show history
History Data:
===============
Stats(Units) Current --/--/-- --/--/-- --/--/-- --/--/-- --/--/-- --/--/--
Port(val)
---------------------------------------------------------------------------------------------
CRC(CRCs) 0(>999) - - - - - -
1(876) - - - - - -
ITW(ITWs) -------
LOSS_SYNC(SyncLoss) -------
LF -------
LOSS_SIGNAL(LOS) -------
PE(Errors)-------
STATE_CHG -------
LR -------
C3TXTO(Timeouts) -------
RX(%) -------
TX(%) -------
UTIL(%) -------
BN_SECS(Seconds) -------
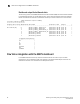
The following example displays all stored historical port performance data for a chassis-based
platform.
switch:admin> mapsdb --show history
History Data:
===============
Stats(Units) Current --/--/-- --/--/-- --/--/-- --/--/-- --/--/-- --/--/--
Port(val)
---------------------------------------------------------------------------------------------
CRC(CRCs) 1/4(>999) - - - - - -
1/16(876) - - - - - -