
Command Reference Guide


Fabric OS Command Reference 1029
53-1002746-01
switchStatusShow
2
switchStatusShow
Displays overall switch status.
SYNOPSIS switchstatusshow
DESCRIPTION Use this command to display the overall status for a switch. In addition, users with a Fabric Watch license
are able to view a listing of unhealthy ports that includes the port index number, the port name, and the
port status.
This command displays the following information: the overall switch status, and the status of the following
contributors:
• Report Time
• Switch Name
• IP address
• Switch State: HEALTHY, MARGINAL, or DOWN
• Duration: hours and minutes (HH:MM) the switch has been in the current state
• Power supplies
• Temperatures
• Fans
• WWN servers (dual-CP systems only)
• Standby CP (dual-CP systems only with HA enabled)
• Blades (bladed systems only)
• Flash
• Marginal ports
• Faulty ports
• Error Ports
Status values are HEALTHY, MARGINAL, or DOWN, depending on whether thresholds established by
switchStatusPolicySet have been exceeded. The overall status is based on the most severe status of
all contributors.
Refer to switchStatusPolicySet for details on the calculation of contributors and overall switch status.
NOTES The execution of this command is subject to Virtual Fabric or Admin Domain restrictions that may be in
place. Refer to Chapter 1, "Using Fabric OS Commands" and Appendix A, "Command Availability" for
details.
OPERANDS None
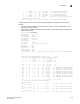
EXAMPLES To display a switch health report on a Brocade 6510 with one faulty port:
switch:user> switchstatusshow
Switch Health Report Report time: 03/12/2011 08:48:00 PM
Switch Name: ras220
IP address: 10.20.10.220
SwitchState: MARGINAL
Duration: 47:42
Power supplies monitor HEALTHY
Temperatures monitor HEALTHY
Fans monitor HEALTHY
Flash monitor MARGINAL