
User's Manual

106 Using the CMC Web Interface
The health status of the fans can be viewed in two ways: from the Chassis
Graphics section on the Chassis Status page or the Fans Status page. The
Chassis Graphics page provides a graphical overview of all fans installed in
the chassis. To view health status for all fans using Chassis Graphics:
1
Log in to the CMC Web interface.
2
The
Chassis Status
page is displayed. The right section of
Chassis
Graphics
depicts the rear view of the chassis and contains the health status
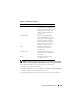
of all fans. Fan health status is indicated by the color of the fan subgraphic:
• Green - fan is present, powered on and communicating with the
CMC; there is no indication of an adverse condition.
• Amber - fan is present, but may or may not be powered on, or may or
may not be communicating with the CMC; an adverse condition may
exist.
• Gray - fan is present and not powered on. It is not communicating
with the CMC and there is no indication of an adverse condition.
3
Use the cursor to hover over the an individual fan subgraphic and a
corresponding text hint or screen tip is displayed. The text hint provides
additional information on that fan.
4
The fan subgraphic is hyperlinked to the corresponding CMC GUI page to
provide immediate navigation to the
Fans Status
page.
The Fans Status page provides the status and speed measurements (in
revolutions per minute, or RPMs, of the fans in the chassis. There can be one
or more fans.
The CMC, which controls fan speeds, automatically increases or decreases
fan speeds based on system wide events. T
he CMC generates an alert and
increases the fan speeds
when the following events occur:
• The CMC ambient temperature threshold is exceeded.
• A fan fails.
• A fan is removed from the chassis.
To view the health status of the fan units:
1
Log in to the CMC Web interface.
2
Select
Fans
in the system tree. The
Fans Status
page displays.