
User's Manual

Troubleshooting and Recovery 301
NOTE: You can configure the CMC to send email or SNMP traps when specific
events occur. For information on configuring CMC to send alerts, see "Configuring
SNMP Alerts" on page 286 and "Configuring Email Alerts" on page 291.
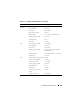
Examples of hardware log entries
critical System Software event: redundancy lost
Wed May 09 15:26:28 2007 normal System Software
event: log cleared was asserted
Wed May 09 16:06:00 2007 warning System Software
event: predictive failure was asserted
Wed May 09 15:26:31 2007 critical System Software
event: log full was asserted
Wed May 09 15:47:23 2007 unknown System Software
event: unknown event
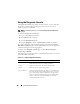
Using the Web Interface
You can view, save a text file version of, and clear the hardware log in the
CMC Web interface.
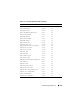
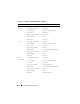
Table 11-8 provides descriptions of the information provided on the
Hardware Log page in the CMC Web interface.
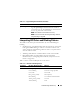
To view the hardware log:
1
Log in to the CMC Web interface.
2
Click
Chassis
in the system tree.
3
Click the
Logs
tab.
4
Click the
Hardware Log
sub-tab. The
Hardware Log
page displays.
To save a copy of the hardware log to your managed station or network:
Click Save Log. A dialog box opens; select a location for a text file of the log.
NOTE: Because the log is saved as a text file, the graphical images used to
indicate severity in the user interface do not appear. In the text file, severity is
indicated with the words OK, Informational, Unknown, Warning, and Severe.
The date and time entries appear in ascending order. If <SYSTEM BOOT> appears
in the Date/Time column, it means that the event occurred during shut down or start
up of any of the modules, when no date or time is available.