
User's Manual

Using the CMC Web Interface 97
Viewing the Health Status of All Servers
The health status for all servers can be viewed in two ways: from the Chassis
Graphics section on the Chassis Status page or the Servers Status page.
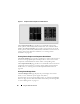
Chassis Graphics provides a graphical overview of all servers installed in the
chassis.
To view health status for all servers using Chassis Graphics:
1
Log in to the CMC Web interface.
2
The
Chassis Status
page is displayed. The center section of
Chassis
Graphics
depicts the front view of the chassis and contains the health
status of all servers. Server health status is indicated by the color of the
server subgraphic:
• Green - server is present, powered on and communicating with the
CMC; there is no indication of an adverse condition.
• Amber - server is present, but may or may not be powered on, or may
or may not be communicating with the CMC; an adverse condition
may exist.
• Gray - server is present and not powered on. It is not communicating
with the CMC and there is no indication of an adverse condition.
The Servers Status page provides overviews of the servers in the chassis.
To view health status for all servers:
1
Log in to the CMC Web interface.
2
Select
Servers
in the system tree. The
Servers Status
page appears.
Table 5-1 provides descriptions of the information provided on the Servers
Status page.
Table 5-1. All Servers Status Information
Item Description
Slot # Displays the location of the server. The slot number is a sequential
number that identifies the server by its location within the chassis.
Present Indicates whether the server is present in the slot (Yes or No). If this
field displays Extension of # (where the # will be 1-8), then the
number that follows it is the main slot of a multi-slot server. When the
server is absent, the health, power state, and service tag information of
the server is unknown (not displayed).