
Users Guide

Viewing chassis information and monitoring
chassis and component health
You can view information and monitor the health of the following:
• CMC
• All severs and individual servers
• IO Modules
• Fans
• Power Supply Units (PSUs)
• Temperature sensors
• PCIe devices
• Storage sleds
Topics:
• Viewing chassis and component summaries
• Viewing chassis summary
• Viewing chassis controller information and status
• Viewing information and health status of all servers
• Viewing information and health status of storage sleds
• Viewing information and health status of the IOMs
• Viewing information and health status of fans
• Viewing front panel properties
• Viewing KVM information and health status
• Viewing information and health status of temperature sensors
Viewing chassis and component summaries
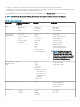
When you log in to the CMC web interface, the Chassis Health page displays the health of the chassis and its components. It displays a
graphical view of the chassis and its components. It is dynamically updated, and the component subgraphic overlays and text hints are
automatically changed to reect the current state.
To view the chassis health, click Chassis Overview. The system displays the overall health status of the chassis, CMC, server modules, IO
Modules (IOM), fans, power supply units (PSUs), storage sleds, and PCIe devices. Detailed information about each component is displayed
when you click that component. In addition, the latest events in the CMC Hardware Log are also displayed. For more information, see the
Dell Integrated Dell Remote Access Controller (iDRAC) User’s Guide.
If your chassis is congured as a Group Lead, the Group Health page is displayed after login. It displays the chassis level information and
alerts. All active, critical, and non-critical alerts are displayed.
5
Viewing chassis information and monitoring chassis and component health 57