
Users Guide


100 Recovering and Troubleshooting the Managed System
Baseboard Management Controller
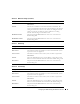
Table 5-5 describes the Baseboard Management Controller properties.
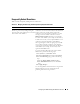
Using the System Event Log (SEL)
The SEL Log page displays system-critical events that occur on the managed system.
To view the System Event Log, perform the following steps:
1
In the
System
tree, click
System
.
2
Click the
Logs
tab and then click
System Event Log
.
The
System Event Log
page displays the event severity and provides other information as shown in
Table 5-6.
3
Click the appropriate
System Event Log
page button to continue (see Table 5-7).
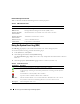
Table 5-5. BMC Information Fields
Field Description
Name "Baseboard Management Controller".
IPMI Version Intelligent Platform Management Interface (IPMI) version.
Number of Possible
Active Sessions
Maximum number of session that can be active at the same time.
Number of Current
Active Sessions
Total number of current active sessions.
Firmware Version Version of the BMC firmware.
LAN Enabled LAN Enabled or LAN Disabled.
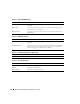
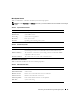
Table 5-6. Status Indicator Icons
Icon/Category Description
A green check mark indicates a healthy (normal) status condition.
A yellow triangle containing an exclamation point indicates a warning (noncritical) status
condition.
A red X indicates a critical (failure) status condition.
A question mark icon indicates that the status is unknown.
Date/Time The date and time that the event occurred. If the date is blank, then the event occurred
at System Boot. The format is mm/dd/yyyy hh:mm:ss, based on a 24-hour clock.
Description A brief description of the event