
API Guide

Example
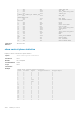
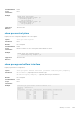
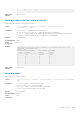
OS10(config)# show qos ingress buffer interface ethernet 1/1/1
Interface ethernet 1/1/1
Speed 40G
-----------------------------------------------------------------------
PG# PRIORITIES qos ALLOTED (Kb)
group Reserved Shared buffer XOFF XON
shared buffer
id buffers MODE threshold
threshold threshold
-----------------------------------------------------------------------
0 4 4 35 DYNAMIC 9
9 8
1 3 3 35 DYNAMIC 9
9 8
2 - - 0 STATIC 0
0 0
3 - - 0 STATIC 0
0 0
4 - - 0 STATIC 0
0 0
5 - - 0 STATIC 0
0 0
6 - - 0 STATIC 0
0 0
7 - 0-2,5-7 8 STATIC 0
0 0
Supported
Releases
10.3.0E or later
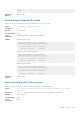
show qos ingress buffer-statistics-tracking
Displays ingress priority group level peak buffer usage count in bytes for the given priority group on a given interface.
Syntax
show qos ingress buffer-statistics-tracking interface ethernet [node/slot/
port] [priority-group {0-7}] [detail]
Parameters
● node/slot/port—Enter the port information.
● [priority-group {0-7}]—Enter the priority-group keyword, followed by the group
number.
● detail—Displays per MMU instance-level statistics in platforms with multiple MMU instances such
as the Z9100-ON series, Z9200-ON series, and MX9116n.
Default Not applicable
Command Mode EXEC
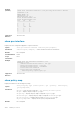
Usage
Information
When BST is enabled, if you make any configuration changes that affect the priority group or priority
mapping configuration, such as removal of class map, addition of class map to policy map (nqos), and so
on, be sure to clear the buffer statistics using the clear qos statistics type buffer-
statistics-tracking command to view the actual peak buffer utilization for the current
configuration.
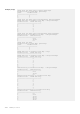
Example
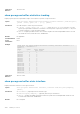
OS10# show qos ingress buffer-statistics-tracking interface ethernet
1/1/1
Interface : ethernet1/1/1
Speed : 0
Priority Peak shared Peak HDRM
Group buffers buffers
------------------------------------------------
0 0 0
1 0 0
2 0 0
3 0 0
4 0 0
5 0 0
1258 Quality of service