
API Guide

S4200 o/p
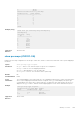
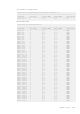
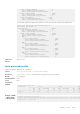
OS10# show qos wred-profile
Profile Name | Green | Yellow | Red |
-------------|-----------------------|---------------------|-----------------------------------|
| MIN MAX DROP-RATE | MIN MAX DROP-RATE | MIN MAX DROP-RATE | WEIGHT | ECN|
| KB KB % | KB KB % | KB KB % | | |
-------------|-----------------------|-------------------- |--------------------|--------|-----|
profile1 | 10 100 100 | | | | Off|
-------------|-----------------------|---------------------|--------------------|--------|-----|
profile2 | | | | | On|
|-----------------------|---------------------|--------------------|--------|-----|
Color Blind ECN Thd| 100 1000 100 |
-------------|-----------------------|---------------------|--------------------|--------|-----|
Supported
Releases
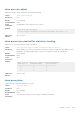
show queuing statistics
Displays QoS queuing statistics information.
Syntax
show queuing statistics interface ethernet node/slot/port[:subport] [wred |
queue number]
Parameters
● node/slot/port[:subport] — Enter the Ethernet interface information.
● queue number — Enter the QoS queue number, from 0 to 7.
Default Not configured
Command Mode EXEC
Usage
Information
Use this command to view all queuing counters. WRED counters are available only at the port level.
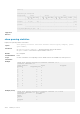
Example
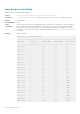
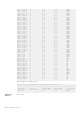
OS10# show queuing statistics interface ethernet 1/1/1
Interface ethernet1/1/1
Queue Packets Bytes Dropped-
Packets Dropped-Bytes
0 0 0
0 0
1 0 0
0 0
2 0 0
0 0
3 0 0
0 0
4 0 0
0 0
5 0 0
0 0
6 0 0
0 0
7 0 0
0 0
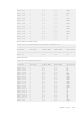
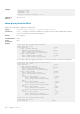
Example (wred)
OS10# show queuing statistics interface ethernet 1/1/1 wred
Interface ethernet1/1/1 (All queues)
Description Packets
Bytes
Output 0
0
Dropped 0
0
1270 Quality of service