
API Guide
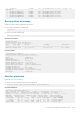

* 1 S4148F-ON 09H9MN X01 TW-09H9MN-28298-713-0026 9531XC2 198
985 006 10
1 S4148F-ON-PWR-1-AC 06FKHH A00 CN-06FKHH-28298-6B5-03NY
1 S4148F-ON-FANTRAY-1 0N7MH8 X01 TW-0N7MH8-28298-713-0101
1 S4148F-ON-FANTRAY-2 0N7MH8 X01 TW-0N7MH8-28298-713-0102
1 S4148F-ON-FANTRAY-3 0N7MH8 X01 TW-0N7MH8-28298-713-0103
1 S4148F-ON-FANTRAY-4 0N7MH8 X01 TW-0N7MH8-28298-713-0104
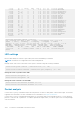
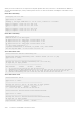
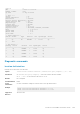
Boot partition and image
Display system boot partition and image information.
● View all boot information in EXEC mode.
show boot
● View boot details in EXEC mode.
show boot detail
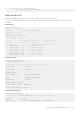
View boot information
OS10# show boot
Current system image information:
===================================
Type Boot Type Active Standby Next-Boot
-----------------------------------------------------------------------------------
Node-id 1 Flash Boot [B] 10.5.0.0 [A] 10.5.0.0 [B] active
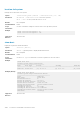
View boot detail
OS10# show boot detail
Current system image information detail:
==========================================
Type: Node-id 1
Boot Type: Flash Boot
Active Partition: B
Active SW Version: 10.5.0.0
Active SW Build Version: 10.5.0.270
Active Kernel Version: Linux 4.9.168
Active Build Date/Time: 2019-07-29T23:35:01Z
Standby Partition: A
Standby SW Version: 10.5.0EX
Standby SW Build Version: 10.5.0EX.252
Standby Build Date/Time: 2019-07-27T17:31:55Z
Next-Boot: active[B]
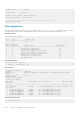
Monitor processes
Display CPU process information.
● View process CPU utilization information in EXEC mode.
●
show processes node-id node-id-number [pid process-id]
View CPU utilization
OS10# show processes node-id 1
top - 09:19:32 up 5 days, 6 min, 2 users, load average: 0.45, 0.39, 0.34
Tasks: 208 total, 2 running, 204 sleeping, 0 stopped, 2 zombie
%Cpu(s): 9.7 us, 3.9 sy, 0.3 ni, 85.8 id, 0.0 wa, 0.0 hi, 0.3 si, 0.0 st
KiB Mem: 3998588 total, 2089416 used, 1909172 free, 143772 buffers
KiB Swap: 399856 total, 0 used, 399856 free. 483276 cached Mem
PID USER PR NI VIRT RES SHR S %CPU %MEM TIME+ COMMAND
9 root 20 0 0 0 0 S 6.1 0.0 5:22.41 rcuos/1
819 snmp 20 0 52736 6696 4132 S 6.1 0.2 2:44.18 snmpd
30452 admin 20 0 22076 2524 2100 R 6.1 0.1 0:00.02 top
Troubleshoot Dell EMC SmartFabric OS10
1393