
API Guide


The 'dry-run' option displays the current state of the system, sessions cleared, and the system state after the load balancing is
done without actually doing it. You can use the "brief" option (both in dry run and actual run) to view only the session
redistribution information.
This command is supported in the NPG mode.
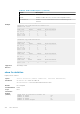
The following table list the fields and description displayed in this command:
Table 54. Fields and Descriptions
Fields Description
Uplink Intf The name of the FC uplink interface
FLOGI Number of Fabric Login Sessions in the FC uplink interface
FDISC Number of Fabric Discovery Sessions in the FC uplink interface
Load Total number of sessions (FLOGI and FDISC) in the FC uplink interface
Speed Link speed of the FC uplink interface
Excess Load
Excess load is the absolute (Current load on the link - ((Minimum load per 8G speed in current
state) * port-speed/8G)). It captures the level to which the corresponding link is over-subscribed
when compared to other FC upstream links in the system.
Node WWPN World Wide Port Name is used for the Fabric Login Request of the Server that is connected to the
OS10 switch. It can be a FCoE server or a FC server.
From Uplink Intf
Interface name of the FC uplink from which the sessions from the server are redistributed.
To Uplink Intf Interface name of the FC uplink to which the sessions are mapped when the server logins.
No. of sessions
Count of redistributed sessions.
Example
OS10#re-balance npg sessions vfabric 100 dry-run
Fabric Id 100 Current State
Uplink FLOGI FDISC Load Speed Excess
Intf (Gbps) Load
----------------------------------------------------------------
Fc 1/1/1 1 9 10 8 7
Fc 1/1/2 3 3 6 16 0
----------------------------------------------------------------
4 12 16 24 7
----------------------------------------------------------------
Session Displacements:
Total No. of Node(s) : 4
No. of Node(s) displaced : 4
-----------------------------------------------------------------------------------------
Node WWPN From Uplink Intf To Uplink Intf No.of sessions
-----------------------------------------------------------------------------------------
20:01:d4:ae:52:1a:ee:54 Fc 1/1/1 Fc 1/1/2 10
21:01:d4:ae:52:1a:ee:54 Fc 1/1/2 Fc 1/1/1 2
22:01:d4:ae:52:1a:ee:54 Fc 1/1/2 Fc 1/1/1 2
23:01:d4:ae:52:1a:ee:54 Fc 1/1/2 Fc 1/1/1 2
Fabric Id 100 State after Re-balancing
Uplink FLOGI FDISC Load Speed Excess
Intf (Gbps) Load
-------------------------------------------------------------------
Fc 1/1/1 3 3 6 8 1
Fc 1/1/2 1 9 10 16 0
-------------------------------------------------------------------
382
Fibre Channel