
Users Guide
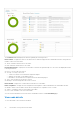
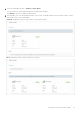
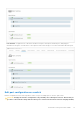
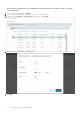
Table Of Contents
- OpenManage Network Integration for SmartFabric Services User Guide Release 2.1
- Contents
- About this guide
- Change history
- Overview of OMNI, SFS, VxRail, and PowerEdge MX
- OpenManage Network Integration
- OMNI vCenter integration
- Access the OMNI stand-alone portal
- Access the OMNI Fabric Management Portal
- OMNI Appliance Management user interface
- SmartFabric management with OMNI
- OMNI feature support matrix
- View SmartFabric instance overview
- View fabric topology
- Manage switches in a fabric
- SmartFabric bulk configuration
- Configure server interface profile
- Configure and manage uplinks
- Configure networks and routing configuration
- Configure global settings for SmartFabric
- View fabric events and compliance status
- OMNI automation support for PowerEdge MX SmartFabric
- OMNI automation support for NSX-T
- Lifecycle management
- Troubleshooting
- Troubleshooting tools
- Unable to add SmartFabric instance in OMNI
- Missing networks on server interfaces
- Unable to launch OMNI UI
- OMNI plug-in does not show service instance
- Unable to register the vCenter in OMNI
- OMNI is unable to communicate with other devices
- Timestamp not synchronized in OMNI
- Reset OMNI VM password

The Overview dashboard displays information regarding the following metrics:
Device Status—Displays the status of the all the devices that are deployed in the SmartFabric instances along with the
number of devices in each status.
● Green—Indicates that the devices are online.
● Red—Indicates that the devices are offline.
Recent Fabric Events—Displays the recent fabric events that are generated by SFS. The events are displayed with the
following information:
● Device—Service tag of the switch.
● Severity—Severity of the event.
○ Critical—Event that is critical that has significant impact.
○ Warning—Event that you should be aware of.
○ Information—Event that does not impact and for informational purpose.
● Time—Time at which the event has occurred.
● Message—Short message about the event occurred.
Device Health—Displays the overall health of all the devices in the fabric.
Fabric Compliance—Displays the misconfiguration and compliance violations identified in the SmartFabric instance.
● Module—Name of the module in which the misconfiguration or compliance errors occurred.
● Status—Compliance status of each module in the fabric.
● Error Count—Number of errors in each module.
You can view the detailed list of all events in the SmartFabric instance from Serviceability page.
View node details
To view the details of the switches in the fabric:
66
SmartFabric management with OMNI