
Users Guide

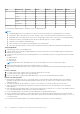
Table Of Contents
- Guide de l’utilisateur de l’Integrated Dell Remote Access Controller 9
- Table des matières
- Présentation de l’iDRAC
- Avantages de l’utilisation de l’iDRAC
- Principales fonctionnalités
- Nouvelles fonctionnalités ajoutées
- Comment utiliser ce guide
- Navigateurs Web pris en charge
- Licences iDRAC
- Fonctionnalités sous licence dans iDRAC9
- Interfaces et protocoles d’accès à iDRAC
- Informations sur les ports iDRAC
- Autres documents utiles
- Contacter Dell
- Accès aux documents à partir du site de support Dell
- Guide d’accès à l’API Redfish
- Ouverture de session dans iDRAC
- Forcer la modification du mot de passe (FCP)
- Connexion à iDRAC à l'aide d'OpenID Connect
- Logging in to iDRAC as local user, Active Directory user, or LDAP user
- Ouverture de session dans l'iDRAC en tant qu'utilisateur local à l'aide d'une carte à puce
- Ouverture d'une session iDRAC à l'aide de la connexion directe
- Accès à l'iDRAC à l'aide de l'interface distante RACADM
- Accès à l'iDRAC à l'aide de l'interface locale RACADM
- Accès à l’iDRAC à l’aide de RACADM du firmware
- Authentification simple à deux facteurs (2FA simple)
- RSA SecurID 2FA
- Affichage de l'intégrité du système
- Connexion à l'iDRAC à l'aide de l'authentification par clé publique
- Sessions iDRAC multiples
- Sécurisation du mot de passe par défaut
- Rétablissement du mot de passe iDRAC par défaut en local
- Réinitialisation du mot de passe par défaut à l'aide de l'utilitaire de configuration iDRAC
- Réinitialisation du mot de passe par défaut à l’aide de l’interface RACADM locale
- Réinitialisation du mot de passe par défaut à l'aide d'OpenManage Mobile
- Réinitialisation du mot de passe par défaut à l’aide du port USB de gestion du serveur
- Modification du mot de passe par défaut à l’aide de USB-NIC
- Réinitialisation à distance du mot de passe iDRAC par défaut
- Rétablissement du mot de passe iDRAC par défaut en local
- Modification du mot de passe de connexion par défaut
- Activation ou désactivation du message d'avertissement du mot de passe par défaut
- Stratégie de niveau de sécurité des mots de passe
- Blocage de IP
- Activation ou désactivation de la connexion directe à l'iDRAC à l'aide de l'interface Web
- Activation ou désactivation des alertes à l’aide de RACADM
- Installation du système géré
- Définition de l'adresse IP d'iDRAC
- Définition de l'adresse IP d'iDRAC à l'aide de l'utilitaire de configuration d'iDRAC
- Définition de l'adresse IP d'iDRAC à l'aide de l'interface Web CMC
- Auto-discovery
- Configuration des serveurs et des composants du serveur à l’aide de la Configuration automatique
- Utilisation des mots de passe cryptés pour une sécurité optimisée
- Modification des paramètres du compte d'administrateur local
- Définition de l'emplacement du système géré
- Optimisation des performances du système et de la consommation d'énergie
- Modification des paramètres thermiques à l’aide de l’interface Web iDRAC
- Modification des paramètres thermiques à l’aide de RACADM
- Modification des paramètres thermiques à l'aide de l'utilitaire de paramètres d'iDRAC
- Modification des paramètres PCIe de circulation de l’air à l’aide de l’interface Web de l’iDRAC
- Installation de la station de gestion
- Configuration des navigateurs web pris en charge
- Configuration d’Internet Explorer
- Configuration de Mozilla Firefox
- Configuration des navigateurs Web pour utiliser la console virtuelle
- Configuration d’Internet Explorer pour qu’il utilise le plug-in HTML5
- Configuration de Microsoft Edge pour utiliser le plug-in HTML5
- Configuration du navigateur Web pour utiliser le plug-in Java
- Configuration d'IE pour qu'il utilise le plug-in ActiveX
- Importation de certificats CA vers la station de gestion
- Affichage des versions localisées de l'interface Web
- Updating device firmware
- Mise à niveau du firmware à l’aide de l’interface Web d’iDRAC
- Planification des mises à jour automatiques du firmware
- Mise à jour de firmware de périphérique à l’aide de RACADM
- Mise à jour du micrologiciel à l'aide de l'interface Web CMC
- Mise à jour du firmware à l’aide de DUP
- Mise à jour du micrologiciel à l’aide de l’interface RACADM
- Mise à jour du micrologiciel à l'aide des Lifecycle Controller Remote Services
- Mise à jour du micrologiciel CMC à partir de l’iDRAC
- Affichage et gestion des mises à jour planifiées
- Restauration du firmware du périphérique
- Restauration du micrologiciel à l'aide de l'interface Web d'iDRAC
- Restauration du micrologiciel à l'aide de l'interface Web CMC
- Restauration du micrologiciel à l’aide de l’interface RACADM
- Restauration du micrologiciel à l'aide du Lifecycle Controller
- Restauration du micrologiciel à l'aide des services distants Lifecycle Controller
- Restauration d'iDRAC
- Restauration facile
- Surveillance d'iDRAC à l'aide d'autres outils de gestion de systèmes
- Prise en charge du profil de configuration de serveur (Server Configuration Profile) – Importation et exportation
- Configuration du démarrage sécurisé à l'aide des paramètres du BIOS ou de F2
- Récupération du BIOS
- Définition de l'adresse IP d'iDRAC
- Plugin Management
- Configuration de l'iDRAC
- Affichage des informations iDRAC
- Modification des paramètres réseau
- Sélection des suites de chiffrement
- Mode FIPS
- Configuration des services
- Using VNC client to manage remote server
- Configuration de l'écran du panneau avant
- Configuration du fuseau horaire et NTP
- Définition du premier périphérique de démarrage
- Activation ou désactivation de la connexion directe entre le SE et l’iDRAC
- Cartes prises en charge pour la connexion directe entre le système d'exploitation et l'iDRAC
- Systèmes d’exploitation pris en charge pour la carte réseau USB
- Activation ou désactivation de la connexion directe à l'iDRAC à l'aide de l'interface Web
- Activation ou désactivation de la connexion directe entre l’OS et l’iDRAC à l’aide de RACADM
- Activation ou désactivation de la connexion directe entre le SE et iDRAC à l’aide de l’utilitaire de paramètres iDRAC
- Obtention de certificats
- Certificats de serveur SSL
- Génération d'une nouvelle demande de signature de certificat
- Inscription automatique de certificats
- Téléversement d'un certificat de serveur
- Affichage du certificat de serveur
- Téléversement d'un certificat de signature personnalisée
- Télécharger un certificat de signature de certificat SSL personnalisé
- Suppression d'un certificat de signature de certificat SSL personnalisé
- Configuration de plusieurs iDRAC à l’aide de RACADM
- Désactivation de l'accès pour modifier les paramètres de configuration iDRAC sur un système hôte
- Autorisation déléguée à l’aide d’OAuth 2.0
- Affichage des informations d'iDRAC et d'un système géré
- Affichage de l'intégrité et des propriétés d'un système géré
- Configuration du suivi des actifs
- Viewing system inventory
- Affichage des informations des capteurs
- Surveillance de l’indice de performances du processeur, de la mémoire et des modules d’entrée/sortie
- Détection de serveur inactif
- Gestion des processeurs graphiques (accélérateurs)
- Vérification de la conformité du système aux normes Fresh Air
- Affichage des données historiques de température
- Affichage des interfaces réseau disponibles sur le SE hôte
- Affichage des interfaces réseau disponibles sur l’OS hôte à l’aide de RACADM
- Visualisation des connexions de structure des cartes mezzanines FlexAddress
- Affichage ou fin des sessions iDRAC
- Configuration de la communication iDRAC
- Communication avec l’iDRAC via une connexion série à l’aide d’un câble DB9
- Configuration du BIOS pour une connexion série
- Activation d'une connexion série RAC
- Activation des modes de base et terminal de connexion série IPMI
- Permutation entre RAC Série et la console série à l'aide d'un câble DB9
- Communication avec l'iDRAC à l'aide de SOL IPMI
- Communication avec l'iDRAC à l'aide d'IPMI sur LAN
- Activation ou désactivation de l’interface distante RACADM
- Désactivation de l'interface locale RACADM
- Activation d'IPMI sur un système géré
- Configuration de Linux pour la console série pendant le démarrage sous RHEL 6
- Configuration du terminal série sous RHEL 7
- Schémas cryptographiques SSH pris en charge
- Communication avec l’iDRAC via une connexion série à l’aide d’un câble DB9
- Configuration des comptes et des privilèges des utilisateurs
- Rôles et privilèges utilisateurs iDRAC
- Caractères recommandés pour les noms d'utilisateur et mots de passe
- Configuration des utilisateurs locaux
- Configuration des utilisateurs d'Active Directory
- Exigences d'utilisation de l'authentification Active Directory pour l'iDRAC
- Mécanismes d'authentification Active Directory pris en charge
- Présentation d'Active Directory avec le schéma standard
- Configuration d'Active Directory avec le schéma standard
- Présentation d’Active Directory avec schéma étendu
- Configuration du schéma étendu Active Directory
- Extension du schéma Active Directory
- Installation de l'extension Dell dans le snap-in Utilisateurs et ordinateurs Active Directory
- Ajout d'utilisateurs iDRAC et de leurs privilèges à Active Directory
- Création d'un objet Périphérique iDRAC
- Création d'un objet Privilège
- Création d'un objet Association
- Octroi de privilèges d'accès utilisateur pour les objets Association
- Ajout d'objets à un objet Association
- Ajout d'utilisateurs ou de groupes d'utilisateurs
- Ajout de privilèges
- Ajout de périphériques iDRAC ou de groupes de périphériques iDRAC
- Configuration d'Active Directory avec le schéma étendu à l'aide de l'interface Web iDRAC
- Configuration d’Active Directory avec le schéma étendu à l’aide de l’interface RACADM
- Test des paramètres Active Directory
- Configuration d'utilisateurs LDAP générique
- Mode de verrouillage de la configuration du système
- Configuration de l'iDRAC pour la connexion directe ou par carte à puce
- Exigences d’ouverture de session Active Directory par connexion directe ou carte à puce
- Configuration d'ouverture de session par connexion directe (SSO) iDRAC pour les utilisateurs Active Directory
- Création d’un utilisateur dans Active Directory avec authentification unique
- Génération d'un fichier Keytab Kerberos
- Configuration d'ouverture de session dans l'iDRAC par connexion directe (SSO) pour les utilisateurs Active Directory à l'aide de l'interface Web
- Configuration d’ouverture de session iDRAC par connexion directe (SSO) pour les utilisateurs Active Directory à l’aide de RACADM
- Paramètres de la station de gestion
- Activation ou désactivation de l'ouverture de session par carte à puce
- Activation ou désactivation de l'ouverture de session par carte à puce à l'aide de l'interface Web
- Activation ou désactivation de l’ouverture de session par carte à puce à l’aide de l’interface RACADM
- Activation ou désactivation de l'ouverture de session par carte à puce à l'aide de l'utilitaire de configuration d'iDRAC
- Configuration de la connexion par carte à puce
- Configuration de la connexion par carte à puce iDRAC pour les utilisateurs Active Directory
- Configuration d'ouverture de session iDRAC par carte à puce pour les utilisateurs locaux
- Connexion à l’aide de la carte à puce
- Configuration d'iDRAC pour envoyer des alertes
- Activation ou désactivation des alertes
- Filtrage des alertes
- Définition d'alertes d'événement
- Définition d'événement de récurrence d'alerte
- Définition d'actions d'événement
- Configuration des paramètres d'alertes par e-mail, d'interruption SNMP ou d'interruption IPMI
- Configuration des destinations d’alerte IP
- Configuration des paramètres d'alerte par e-mail
- Configuration des événements WS
- Configuration des événements Redfish
- Surveillance des événements de châssis
- ID de message d'alerte
- Gestionnaire de groupe iDRAC 9
- Gestion des journaux
- Surveillance et gestion de l’alimentation de l’iDRAC
- Surveillance de l'alimentation
- Définition du seuil d’avertissement de consommation d'alimentation
- Exécution d’opérations de contrôle de l’alimentation
- Plafonnement de l’alimentation
- Configuration des options d'alimentation
- Activation ou désactivation du bouton d’alimentation
- Refroidissement Multi-Vector
- iDRAC Direct Updates
- Configuration, surveillance et inventaire des périphériques réseau
- Inventaire et surveillance des périphériques réseau
- Inventorying and monitoring FC HBA devices
- Inventorying and monitoring SFP Transceiver devices
- Telemetry Streaming
- Capture de données série
- Configuration dynamique des adresses virtuelles, de l’initiateur et de la cible de stockage
- Cartes prises en charge pour l'optimisation d'identité d'E/S
- Versions du micrologiciel des cartes réseau prises en charge pour l’optimisation de l’identité des E/S
- Comportement de l'adresse virtuelle/attribuée à distance et de la stratégie de persistance lorsque le contrôleur iDRAC est défini sur le mode Console ou Adresse attribuée à distance
- Comportement du système pour Adresse Flex et l'identité d'E/S
- Activation ou désactivation de l'optimisation d'identité d'E/S
- Seuil d’usure du disque SSD
- Configuration des paramètres de la stratégie de persistance
- Managing storage devices
- Présentation des concepts RAID
- Qu’est-ce que la technologie RAID ?
- Organisation du stockage des données à des fins de disponibilité et de performances
- Choix des niveaux de RAID
- Niveau de RAID 0 - Agrégation par bandes
- Niveau de RAID 1 - Mise en miroir
- Niveau de RAID 5 ou segmentation avec parité distribuée
- Niveau de RAID 6 - segmentation avec parité distribuée supplémentaire
- Niveau de RAID 50 - segmentation sur des ensembles de RAID 5
- Niveau de RAID 60 - segmentation sur des ensembles de RAID 6
- Niveau de RAID 10 -segmentation-miroirs
- Comparaison des performances des niveaux RAID
- Contrôleurs pris en charge
- Boîtiers pris en charge
- Récapitulatif des fonctionnalités prises en charge pour les périphériques de stockage
- Inventaire et surveillance des périphériques de stockage
- Affichage de la topologie des périphériques de stockage
- Gestion des disques physiques
- Gestion de disques virtuels
- Création de disques virtuels
- Modification des règles de cache des disques virtuels
- Suppression de disques virtuels
- Vérification de cohérence de disque virtuel
- Initialisation des disques virtuels
- Chiffrement de disques virtuels
- Affectation ou annulation de l'affectation de disques de secours dédiés
- Gestion de disques virtuels à l’aide de l’interface web
- Gestion de disques virtuels à l’aide de RACADM
- Fonctionnalités de configuration RAID
- Gestion des contrôleurs
- Configuration des propriétés du contrôleur
- Importation ou importation automatique d'une configuration étrangère
- Suppression d'une configuration étrangère
- Réinitialisation de la configuration d'un contrôleur
- Basculement de mode de contrôleur
- Opérations de l’adaptateur HBA SAS 12 Gbits/s
- Surveillance de l'analyse de la prédiction d'échec sur des disques
- Opérations de contrôleur en mode non RAID ou en mode HBA
- Exécution de tâches de configuration RAID sur plusieurs contrôleurs de stockage
- Gestion de la mémoire cache préservée
- Managing PCIe SSDs
- Gestion des boîtiers ou des fonds de panier
- Choix du mode de fonctionnement pour l'application des paramètres
- Affichage et application des opérations en attente
- Périphériques de stockage : scénarios d'opérations d’application
- Clignotement ou annulation du clignotement des LED des composants
- Redémarrage à chaud
- Présentation des concepts RAID
- Paramètres du BIOS
- Configuration et utilisation de la console virtuelle
- Résolutions d'écran prises en charge et taux de rafraîchissement correspondants
- Configuration de la console virtuelle
- Prévisualisation de la console virtuelle
- Lancement de la console virtuelle
- Utilisation du Visualiseur de console virtuelle
- eHTML5 based virtual console
- HTML5 based virtual console
- Synchronisation des pointeurs de souris
- Envoi de toutes les frappes de touches via la console virtuelle pour le plug-in Java ou ActiveX
- Utilisation de l’iDRAC Service Module
- Utilisation d’un port USB pour la gestion de serveur
- Utilisation de la fonction Quick Sync 2 (Synchronisation rapide)
- Gestion du média virtuel
- Lecteur et périphériques pris en charge
- Configuration de média virtuel
- Accès à un média virtuel
- Lancement de Média Virtuel à l'aide de la console virtuelle
- Lancement de Média Virtuel sans utiliser la console virtuelle
- Ajout d'images Média Virtuel
- Affichage des informations détaillées d'un périphérique virtuel
- Accès aux pilotes
- Réinitialisation USB
- Mappage d'un lecteur virtuel
- Dissociation d'un lecteur virtuel
- Définition de la séquence de démarrage via le BIOS
- Activation du démarrage unique pour Média Virtuel
- Gestion de la carte SD vFlash
- Configuration d'une carte SD vFlash
- Gestion des partitions vFlash
- Création d'une partition vide
- Création d'une partition à l'aide d'un fichier image
- Formatage d'une partition
- Affichage des partitions disponibles
- Modification d'une partition
- Connexion et déconnexion de partitions
- Suppression de partitions existantes
- Téléchargement du contenu d'une partition
- Démarrage à partir d'une partition
- Utilisation de SMCLP
- Déploiement de systèmes d’exploitation
- Dépannage d'un système géré à l'aide d'iDRAC
- Utilisation de la console de diagnostic
- Affichage des codes du Post
- Viewing boot and crash capture videos
- Affichage des journaux
- Affichage de l'écran du dernier blocage du système
- Affichage de l’état du système
- Voyants des problèmes matériels
- Affichage de l'intégrité du système
- Vérification des messages d'erreur dans l'écran d'état du serveur
- Redémarrage d'iDRAC
- Rétablir les paramètres par défaut personnalisés (RTD)
- Effacement des données système et utilisateur
- Restauration des paramètres par défaut définis en usine d'iDRAC
- Intégration de SupportAssist dans l'iDRAC
- Questions fréquentes
- Journal des événements système
- Configuration d’un e-mail d’expéditeur personnalisé pour les alertes iDRAC
- Sécurité du réseau
- Diffusion de la télémétrie
- Active Directory
- Connexion directe
- Ouverture de session avec une carte à puce
- Console virtuelle
- Média virtuel
- Une carte SD vFlash
- Authentification SNMP
- Périphériques de stockage
- Processeurs graphiques (accélérateurs)
- Module des services des iDRAC (iSM)
- RACADM
- Définition définitive du mot de passe par défaut pour calvin
- Divers
- Scénarios de cas d'utilisation
- Dépannage d'un système géré inaccessible
- Obtention des informations système et évaluation de l'intégrité du système
- Définition des alertes et configuration des alertes par e-mail
- Affichage et exportation du journal d’événements système et du journal Lifecycle
- Interfaces de mise à niveau du micrologiciel iDRAC
- Exécution d’un arrêt normal
- Création d'un compte utilisateur Administrateur
- Lancement de la console distante du serveur et montage d’une clé USB
- Installation sans système d’exploitation à l’aide de Virtual Media connecté et du partage de fichier à distance
- Gestion de la densité d'un rack
- Installation d'une nouvelle licence électronique
- Application des paramètres de configuration d’identité d’E/S pour plusieurs cartes réseau lors du redémarrage d’un système hôte unique

● Fiber channel
● IB adapter ports
Most useful transceiver information are Serial number and Part number from transceiver EPROM. These would allow to verify the
remotely installed transceivers, when troubleshooting connectivity issues. For each SFP Transceiver device, you can view the following
information for the ports:
● Vendor Name
● Part Number
● Revision
● Serial Number
● Device Identifier
● Interface Type
Monitoring SFP Transceiver devices using web interface
To view the SFP Transceiver device information using Web interface, go to System > Overview > Network Devices and click on
particular device. For more information about the displayed properties, see iDRAC Online Help.
The page name also displays the slot number where the transceiver device is available under Port statistics.
Monitoring data for SFP devices is only available for active SFPs. Following are the information displayed:
● TX Output Power
● TX Bias Current
● RX Input Power
● Vcc Voltage
● Temperature
Monitoring SFP Transceiver devices using RACADM
To view the SFP Transceiver device information using RACADM, use the networktransceiverstatistics command.
For more information, see the Guide de la CLI RACADM de l’iDRAC disponible à l’adresse https://www.dell.com/idracmanuals.
Telemetry Streaming
Telemetry enables users to collect and stream real-time device metrics, events, and data logs from a PowerEdge server to a subscribed
external client or server application. Using Telemetry, you can set the type and frequency of reports that needs to be generated.
NOTE: The feature is supported on all the platforms and it requires iDRAC Datacenter license.
Telemetry is one-to-many solution for collecting and streaming the live system data from one or more PowerEdge servers (iDRAC) to a
centralized 'Remote Server Monitoring, Analysis, and Alerting service'. The feature also supports on-demand data collection of the data.
The telemetry data includes metrics/inventory and logs/events. The data can be streamed (pushed out) or collected (pulled) from iDRAC
to or by remote consumers like Redfish client and Remote Syslog Server. The telemetry data is also provided to the iDRAC SupportAssist
data collector on demand. The data collection and report is based on predefined Redfish telemetry metrics, trigger, and report definitions.
The telemetry streaming settings can be configured using iDRAC web interface, RACADM, Redfish, and Server Configuration Profile
(SCP).
To configure Telemetry, enable or select the required device reports or logs that define the behavior and frequency of data streaming. Go
to Configuration > System Settings page to configure Telemetry. Data streaming is automatic until the Telemetry is disabled.
Following table describes the metric reports that can be generated using telemetry:
Type
Metric Group Inventory Sensor Statistics Configuration Metrics
I/O Devices NICs No Yes Yes No No
FC HBAs No Yes Yes No No
Server Devices CPUs No Yes No No Yes
Memory No Yes No No Yes
Configuration, surveillance et inventaire des périphériques réseau 219