
Concept Guide
Document 365/385
2.3 Configuring Telemetry Report Triggers (optional)
Telemetry triggers are a means to generate and stream reports that are based on an error or warning
condition. These reports are predefined based on Lifecycle log (LCL) events for error or warming conditions. If
configured, a new report is generated before the scheduled report interval when a trigger occurs. The default
configuration includes the triggers that are relevant for a report. You can modify the trigger association.
HTTP PATCH /redfish/v1/Managers/iDRAC.Embedded.1/Attributes
Payload: {"Attributes":{"Telemetry<report>.1.ReportTriggers": “<trig1, trig2>"}
e.g.
curl -s -k -u <user>:<password> -X PATCH https://<IDRAC-
IP>/redfish/v1/Managers/iDRAC.Embedded.1/Attributes
-H 'Content-Type: application/json' -d '{"Attributes":
{"TelemetryPowerMetrics.1.ReportTriggers": "CPUCriticalTrigger, CPUWarnTrigger"}}'
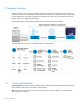
2.4 Receiving Telemetry Reports
After telemetry streaming is configured, the telemetry reports can be received by a Redfish client using these
methods. First two are streaming and the last is pull a report on demand.
1. POST to Subscription method
2. SSE Method
3. Pull (GET) Method
2.4.1 POST to Subscription Method
In this method Redfish clients first create subscription(s) using destination (ip:port) and desired reports in the
subscriptions request. If no report list is specified then all enabled reports will be streamed. Then the clients start
HTTP event listener on the destination that listens on the port to receive the telemetry report streams periodically,
as configured above. Maximum 8 subscriptions, including internal SSE subscriptions (see SSE method), can be
created.
To create a subscription:
curl -s -k -u <user>:<password> -X POST https://<IDRAC-
IP>/redfish/v1/EventService/Subscriptions
-H 'Content-Type: application/json'
-d '{"Destination": "https://<listener ip:port>",
"EventFormatType": "MetricReport",
"Context": "TelmetryTest",
"Protocol": "Redfish",