
Administrator Guide

Executive summary
4 Telemetry Streaming with iDRAC9 Server -Telemetry Performance Reports | ID 457
Executive summary
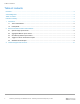
Beginning with iDRAC9 v4.00.00.00 firmware and a Datacenter license, IT managers can integrate advanced
server hardware operation telemetry into their existing analytics solutions. Telemetry is provided as granular,
timeseries data that is streamed, or pushed, compared to inefficient, legacy polling, or pulled, methods. The
advanced agent-free architecture in iDRAC9 provides over 180 data metrics that are related to server and
peripherals operations. Metrics are precisely timestamped and internally buffered to allow highly efficient data
stream collection and processing with minimal network loading. This comprehensive telemetry can be fed into
analytics tools to predict failure events, optimize server operation, and enhance cyber resiliency.
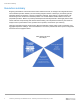
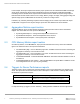
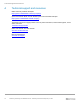
Telemetry performance reports include sensor data which indicates compute usage, power consumption, and
aggregate temperature readings. The metric definitions in each of the performance metric reports is categorized
and shown in the infographics below.
System Usage Metric Report
CPUUsage
IOUsage
MemoryUsage
AggregateUsage
Aggregation Metrics
Metric Report
SystemAvgInletTempHour
SystemMaxInletTempHour
SystemMaxPowerConsumption
iDRAC Telemetry Peformance
Metric Reports