
Administrator Guide

Server Performance metrics and workflows
8 Telemetry Streaming with iDRAC9 Server -Telemetry Performance Reports | ID 457
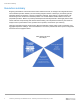
2.5 Workflows and Examples
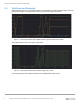
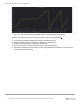
iDRAC9 telemetry feature for downstream analytics and visualization by plotting streamed metric values for
gaining useful insights. The image below shows a plot of System Usage metric values.
Figure 1 – A time lapse Grafana plot of iDRAC telemetry System Usage metric values
This graph illustrates a plot of the system usage metric.
Figure 2 – A time lapse Grafana plot of System Usage metric values
The next image shows a time lapse Grafana plot of CPUMemMetrics report metrics.