
Administrator Guide
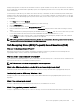
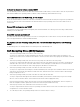
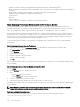
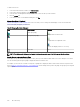
Table Of Contents
- Dell EqualLogic Group Manager Administrator’s Guide PS Series Firmware Version 10.0 FS Series Firmware Version 4.0
- About This Manual
- About Group Manager
- Architecture Fundamentals
- Set Up the iSCSI SAN
- Post-Setup Tasks
- Data Security
- About Group-Level Security
- Enable or Disable GUI and CLI Access
- Switch Administration Authentication Type
- About Administration Accounts
- Types of Administration Accounts
- Differences Between Authentication Methods
- Administration Account Attributes
- About Security Access Protocols
- SSH Key Pair Authentication
- Minimum Requirements for Administrative Access
- Create a Local Administration Account
- Modify Local Administration Accounts
- Delete Local Administration Accounts
- About RADIUS Accounts
- About LDAP Authorization and Active Directory
- About Single Sign-On
- About SNMP Access to the Group
- About VDS and VSS Authentication
- About IPsec
- About Dedicated Management Networks
- Secure Erase
- About Volume-Level Security
- Connect Initiators to iSCSI Targets
- Access Control Methods
- About Access Policies
- Access Policies: Use Cases
- Create a New Access Policy
- Create a New Basic Access Point
- Modify or Delete a Basic Access Point
- Modify Access Policies and Basic Access Points by Volume
- Associate Access Control Policies with Volumes
- Create an Access Policy Group
- Associate an Access Policy Group to a Volume
- Manage Access Controls for VDS/VSS Access
- Authenticate Initiators with CHAP
- Display Local CHAP Accounts
- Create a Local CHAP Account
- Modify a Local CHAP Account
- Delete a Local CHAP Account
- Configure CHAP for Initiator Authentication on Existing Volumes
- Configure CHAP for Initiator Authentication on New Volumes
- Configure CHAP Accounts on a RADIUS Authentication Server
- Configure Target Authentication
- About iSNS Servers
- Prevent Discovery of Unauthorized Targets
- About Multihost Access to Targets
- About Snapshot Access Controls
- About NAS Container Security
- PS Series Group Operations
- About Group Network Configuration
- Modify the Group IP Address or Group Name
- Add a Member to an Existing Group
- Set the RAID Policy and Pool for a New Member
- Enable and Disable a Volume RAID Preference
- About Overriding Automatic Load Balancing
- Shut Down a Group
- Create an Empty Storage Pool
- Create a Storage Pool from an Existing Member
- Change a Storage Pool Name or Description
- Merge Storage Pools
- Delete a Storage Pool
- About Groupwide Volume Defaults
- About Space Borrowing
- About Compression of Snapshots and Replicas
- Compression Prerequisites
- About Rehydration
- About Compression Statistics
- Compression Statistics by Pool
- Compression Statistics by Member
- Compression Statistics by Volume
- Member Compression States
- Enable Compression
- Suspend Compression
- Resume Compression
- View Compression Statistics by Pool
- View Compression Statistics by Member
- View Compression Statistics by Volume
- Compression Commands in the CLI
- About Volumes
- Create a Volume
- Modify a Volume Name or Description
- Modify a Volume Permission
- Modify a Volume Alias
- Modify the Administrator for a Volume
- About Smart Tags
- Set a Volume Offline or Online
- Delete a Volume
- About Volume Collections
- About Volume Folders
- About Restoring Deleted Volumes
- About Changing the Reported Volume Size
- About Reclaiming Unallocated Space
- Set a Volume or Snapshot with Lost Blocks Online
- Volume and Snapshot Status
- Volume and Snapshot Requested Status
- About Managing Storage Capacity Utilization On Demand (Thin Provisioning)
- About Improving Pool Space Utilization (Template Volumes and Thin Clones)
- About Data Center Bridging
- VMware Group Access Panel
- NAS Operations
- NAS Cluster Operations
- NAS Cluster Configuration
- NAS Cluster Post-Setup Tasks
- Modify a NAS Cluster Name
- Modify NAS Clusterwide Default NAS Container Settings
- Select an NFS Protocol Version
- Modify the Size of the NAS Reserve
- Add a Local Group for a NAS Cluster
- Delete a Local Group from a NAS Cluster
- Add a Local User on a NAS Cluster
- Modify a Local User on a NAS Cluster
- Delete a Local User from a NAS Cluster
- Map Users for a NAS Cluster
- Set the User Mapping Policy for a NAS Cluster
- Delete a User Mapping for a NAS Cluster
- Configure an Active Directory for a NAS Cluster
- Configure Preferred Domain Controllers
- Leave Active Directory
- Configure or Modify NIS or LDAP for a NAS Cluster
- Delete NIS or LDAP Configuration for a NAS Cluster
- Modify the Client Network Configuration
- Configure DNS for a NAS Cluster
- About the Internal Network Required for NAS Configuration
- About NAS Cluster Maintenance Mode
- Shut Down and Restart a NAS Cluster Manually
- About Deleting a NAS Cluster
- NAS Controller Operations
- NAS Container Operations
- Create a NAS Container
- Modify NAS Clusterwide Default NAS Container Settings
- Modify NAS Clusterwide Default NAS Container Permissions
- Modify NAS Clusterwide Default NFS Export Settings
- Modify NAS Clusterwide Default SMB Share Settings
- Modify a NAS Container Name
- Modify the Size of a NAS Container
- Modify the Snapshot Reserve and Warning Limit for a NAS Container
- Modify the In-Use Space Warning Limit for a NAS Container
- Modify a NAS Container for Few Writers Workloads
- Delete a NAS Container
- NFS Netgroups
- Access NFS Exports
- Create an NFS Export
- Modify the Client Access Setting for an NFS Export
- Modify the Permission for an NFS Export
- Modify the Trusted Users for an NFS Export
- Modify NAS Clusterwide Default NFS Export Settings
- Modify an NFS Export Directory
- Modify an NFS Export
- About NFS Export Security Methods
- Delete an NFS Export
- About SMB Shares
- Access SMB Shares in Windows
- Mount a NAS SMB Share from UNIX
- Create an SMB Share
- Set the SMB Password
- Modify an SMB Share Directory
- Delete an SMB Share
- Rebalance SMB Client Connections Across NAS Controllers
- Enable or Disable SMB Message Signing
- Enable or Disable SMB Message Encryption
- Modify SMB Share NAS Antivirus Settings
- Access-Based Enumeration
- About SMB Home Shares
- Create a NAS Thin Clone
- Client Networks
- About NAS Antivirus Servers
- How NAS Antivirus Protects Data
- NAS Antivirus Server Specifications
- Add a NAS Antivirus Server
- Modify a NAS Antivirus Server
- Delete a NAS Antivirus Server
- About NAS Antivirus Clusterwide Defaults
- Enable the NAS Antivirus Service on an SMB Share
- Monitor the NAS Antivirus Service
- NAS Directory Paths and File Types Scan
- Antivirus Policy
- Access Infected Files
- Create a NAS Container Quota
- Modify a NAS Container Quota
- Delete a NAS Container Quota
- About Quota Directories
- Quotas and NAS Containers
- About NAS Thin Provisioning
- NAS Container Storage Space Terminology
- About NAS Containers
- About Data Rehydration
- NAS Container Data Reduction
- Enable Data Reduction
- Modify NAS Container Data Reduction Settings
- Modify NAS Cluster Default Data Reduction Settings
- Data Reduction Policy
- Create Default Data Reduction Properties
- About NAS Data Reduction Schedules
- FS Series VAAI Plugin
- Diagnose and Resolve NAS Cluster and PS Series Issues
- About Backing Up and Protecting Your Data
- About Volume Data Protection
- Protect NAS Container Data with NDMP
- About Snapshots
- How Snapshots Work
- About Snapshot Reserve
- Create a Snapshot
- Set a Snapshot Online or Offline
- Clone a Snapshot to Create a New Volume
- Modify a Snapshot Name or Description
- Delete Snapshots
- Restore a Volume from a Snapshot
- About Snapshots and NAS Container Data
- About Snapshot Collections
- About Snapshot Space Borrowing
- About Replication
- About Schedules
- About Data Recovery
- About Recovering Data from a Snapshot
- Failback to Primary Operation (Manual)
- Move a Failback Replica Set to a Different Pool
- Replicate to Partner Operation (Manual)
- Switch Partner Roles Permanently
- Make a Temporary Volume Available on the Secondary Group
- Replicate a Recovery Volume to the Primary Group
- Promote an Inbound Replica Set to a Recovery Volume
- How to Handle a Failed Operation
- Fail Back to the Primary Group
- Volume Failover and Failback
- Recover Data from a Replica
- About NAS Disaster Recovery
- About Cloning Volumes
- About Synchronous Replication
- How Synchronous Replication Works
- Compare SyncRep and Traditional Replication
- How Synchronous Replication Protects Volume Availability in Different Scenarios
- Requirements for Using Synchronous Replication
- Synchronous Replication States
- About System Snapshots and SyncRep
- About Synchronous Replication and Snapshots
- About Synchronous Replication Switches and Failovers
- About Synchronous Replication Volume Collections
- About Using Thin Clones and Templates with Synchronous Replication
- Configure Synchronous Replication (SyncRep) on a Volume
- Disable Synchronous Replication (SyncRep) for a Volume
- Monitor Synchronous Replication (SyncRep) Volumes
- Pause Synchronous Replication (SyncRep)
- Resume Synchronous Replication (SyncRep)
- Enable Synchronous Replication (SyncRep) for a Volume Collection
- Disable Synchronous Replication (SyncRep) for a Volume Collection
- Change the Pool Assignment of a Synchronous Replication (SyncRep) Volume
- View the Distribution of a Volume Across Pools
- About Switching and Failing Over SyncRep Pools
- Disconnect the SyncActive Volume
- About Self-Encrypting Drives (SEDs) and AutoSED
- Scenarios Covered by AutoSED
- Scenarios Not Covered by AutoSED
- About Self-Encrypting Drives (SED)
- How Self-Encryption Protects Data
- About SED Members in a Group
- Back Up a Self-Encrypting Drive (SED) Key
- Self-Encrypting Drives (SED) Frequently Asked Questions (FAQ)
- Why are my backups always different?
- Why is a secure-erase command not available?
- What is the difference between a locked drive and a securely erased drive?
- I accidentally reset an SED array. What can I do?
- What if the entire array is stolen?
- What if the grpadmin password is stolen?
- Is it safe to discard or return a locked SED?
- Can I add SEDs to a non-SED array, or vice versa?
- Does a SED system also use RAID?
- Does SED encrypt my volumes?
- If I create a new set of backup units, does the new set invalidate the previous set of backup units?
- Self-Encrypting Drives (SED) Examples
- Self-Encrypting Drives (SED) Advanced Encryption
- About Monitoring
- Tools That Monitor and Manage Storage Performance
- Monitor Group Members
- About Storage Performance
- Monitor Administrative Sessions
- Monitor Snapshot Schedules
- Monitor Volumes and Snapshots
- About Monitoring Replication
- About Monitoring Replication Operations
- Monitor Alarms and Operations
- About Diagnostics
- Troubleshooting Performance Issues
- Reference: GUI Panels, Wizards, and Dialog Boxes
- About Groups
- About Monitoring
- About NAS Clusters
- About Replication
- About Volumes
- Access Control List Panel
- Access Control List Panel (for selected volume)
- Access Panel - SNMP
- Access Panel
- Access Policies Panel
- Accounts and Groups Panel
- Active Directory Panel
- Active Directory Settings Dialog Box
- Active Sessions Panel
- Add Access Policies Dialog Box
- Add Access Policies Dialog Box
- Add Access Policy Groups to Volume Dialog Box
- Add/Modify CHAP Account Dialog Box
- Add Local Group Dialog Box
- Add Local User Dialog Box
- Add NAS Controller Pair Message
- Add NAS Controller Pair Wizard
- Administrative Sessions Panel
- Advanced NAS Container Information Dialog Box
- Alarms and Operations Panel
- Antivirus Default for SMB Shares Panel
- Attach NAS Controller Dialog Box
- Antivirus Panel
- Audit Log Panel
- Authentication Panel
- Change Account Password Dialog Box
- Change Group Membership Password Dialog Box
- Change Group Time Dialog Box
- Choosing a RAID Policy
- SMB Administrator Password Dialog Box
- SMB Administrator Password Panel
- SMB Client Connections Panel
- Client Network Panel
- Clone Snapshot Wizard
- Clone Template Volume Wizard
- Clone Volume Replica Wizard
- Clone Volume Wizard
- Collection Status Panel
- Collection Volumes Panel
- Component Versions Panel
- Configure Active Directory Wizard
- Configure Container Replication Dialog Box
- Configure Dedicated Management Network Dialog Box
- Configure DMA Servers Dialog Box
- Configure DNS Dialog Box
- Configure Member Wizard
- Configure NAS Antivirus Servers Dialog Box
- Configure NAS Cluster Wizard
- Configure Replication Partner Wizard
- Configure Replication Settings Dialog Box
- Configure SMTP Servers Dialog Box
- Configure SyncRep Wizard
- Configure Volume Replication Wizard
- Control Module Panel
- Convert Recovery Volume Wizard
- Cooling Fans Panel
- Copy Data to Transfer File Wizard
- Copy Tags from Volume Dialog Box
- Counter Set Management Dialog Box
- Create Administration Account Wizard
- Create SMB Share Wizard
- Create Custom Snapshot Collection Wizard
- Create NAS Container Wizard
- Create NAS Snapshot Dialog Box
- Create NFS Export Wizard
- Create or Modify Data Reduction Schedule Dialog Box
- Create Quota Wizard
- Create a Replica Dialog Box
- Create Replica Collection Dialog Box
- Create Schedule Wizard
- Create Snapshot Dialog Box
- Create Storage Container Wizard
- Create Storage Pool Wizard
- Create Thin Clone Wizard
- Create Volume Collection Wizard
- Create Volume Wizard
- Create and Rename Volume Folder Dialog Boxes
- Custom Snapshot Collections Panel
- Customize Filter Dialog Box
- Data Reduction Settings Panel
- Data Transfers on Local Machine Panel
- Date and Time Panel
- DCB Details Dialog Box
- Default Data Reduction Policy Panel
- Default NAS Container Permissions Panel
- Default NAS Container Settings Panel
- Default NFS Export Settings Panel
- Delegated Space Distribution Across Storage Pools Panel
- Delete Local Group Message
- Delete Local User Message
- Delete NAS Cluster Message
- Delete NAS Container Message
- Delete NAS Container Snapshots Dialog Box
- Delete NAS Container Snapshot Message
- Delete Snapshot Message
- Delete Volume Dialog Box
- Detach a NAS Controller Message
- Disable Active Directory Message
- Discover NAS Devices Dialog Box
- Discover NAS Devices Wizard
- Disk Array Summary Panel
- Disk Encryption Panel
- Disk Versions Panel
- EIP Card or OPS Panel
- Email Event Notifications Panel
- Enter Maintenance Mode Message
- EqualLogic Software Updates
- Event Logs Panel
- Failback Recovery Volume Dialog Box
- Filter Volumes Dialog Box
- Firmware Panel
- Find Objects Panel
- General Member Information Panel
- General NAS Container Information Panel
- General NAS Cluster Information Panel
- General Partner Information Panel
- General Pool Information Panel
- General Replica Set Information Panel
- General Replica Set Information Panel
- General Settings Panel for Group
- General Snapshot Information Panel
- General Snapshot Information Panel
- General Volume Information Panel
- Generate and Email Diagnostic Reports Wizard
- Group Disk Space Panel
- Group Disk Space Panel
- Group Disk Space Panel
- Group Information Panel
- Group Manager Performance Monitor Dialog Box
- Group Members Panel
- Identification Panel
- Inbound Replica Containers Panel
- Inbound Replica Containers Panel
- Inbound Volume Replication Panel
- Inbound Volume Replication Panel
- Inbound Replicas Panel
- Installed Disks Panel
- IP Configuration Panel
- iSCSI Authentication Panel
- iSCSI Connections Panel
- iSCSI Connections Panel (Snapshots)
- iSCSI Connections Panel (Member)
- iSCSI Connections Panel (Volumes)
- iSCSI Discovery Panel
- iSCSI Settings Panel
- Join Domain / Enable Single Sign-On Dialog Box
- Load Balancing Panel
- Load Data from Transfer File Wizard
- Local CHAP Accounts Panel
- Local Groups Panel
- Local Users Panel
- Manage Delegated Space Dialog Box
- Manage Replication Services Dialog Box
- Manage Tags Dialog Box
- Manual Transfer Utility Window
- Manual Map Users Dialog Box
- Manual User Mapping Dialog Box
- Member Health Status Panel
- Member Space Panel
- Memory Cache Panel
- Merge Storage Pools Panel
- Modify a Volume Collection Dialog Box
- Modify Access Policy Group Dialog Box
- Modify Administration Account Dialog Box
- Modify Client Network Dialog Box
- Modify Custom Snapshot Collection Dialog Box
- Modify IP Settings of Network Interface Dialog Box
- Modify Member Settings Dialog Box
- Modify NAS Snapshot Settings Dialog Box
- Modify NDMP Settings Dialog Box
- Modify Passwords Dialog Box (for Replication)
- Modify Policy Dialog Box
- Modify Quota Dialog Box
- Modify RAID Configuration Dialog Box
- Modify Replica Set Wizard
- Modify Replication Partner Dialog Box
- Modify Replication Partner IP Address Dialog Box
- Modify SAN Network Dialog Box
- Modify Schedule Dialog Box
- Modify Settings Dialog Box (NAS Containers)
- Modify Snapshot Policy Dialog Box
- Modify Snapshot Properties Dialog Box
- Modify Storage Container Dialog Box
- Modify Storage Pool Dialog Box
- Modify User Preferences Dialog Box
- Modify Volume Settings Dialog Box
- Modifying Volume Replication Configuration Settings
- Most Recent Login by Account Panel
- Move Delegated Space Dialog Box
- Move Member Dialog Box
- Move to Folder Dialog Box
- Move Recovery Volume Dialog Box
- Move Replica Set Dialog Box
- Move Volume Dialog Box
- NAS Battery Panel
- NAS SMB Connections Panel
- NAS SMB Shares Panel
- NAS Client Panel
- NAS Cluster Access Panel
- NAS Configuration Window
- NAS Container and Snapshot Space Panel
- NAS Containers Panel
- NAS Cooling Fans Panel
- NAS Data Reduction Schedules Panel
- NAS Local Containers Panel
- NAS Local Disks Panel
- NAS Member Information Panel
- NAS Members Panel
- NAS Power Supplies Panel
- NAS Quotas Panel
- NAS Replica Containers Panel
- NAS Replication Schedules Panel
- NAS Replication Status Panel
- NAS Replication Summary Panel
- NAS Replication Summary Panel
- NAS Replications Detected
- NAS Reserve Panel
- NAS SAN Panel
- NAS Schedules Summary Panel
- NAS Snapshot and Replication Schedules Panel
- NAS Snapshot Schedules Panel
- NAS Snapshot Summary Panel
- NAS Snapshots Panel
- NAS Temperature Sensor Panel
- NAS Thin Clone Summary Panel
- NAS Member Health Status Panel
- NDMP Panel
- Network Management Panel
- New Access Policy Dialog Box
- New Access Policy Group Dialog Box
- New Basic Access Point Dialog Boxes
- New Extended Access Point Dialog Box
- NFS Exports and SMB Shares Panel
- NFS Exports Panel
- NFS Panel
- Outbound NAS Replica Containers Panel
- Outbound NAS Replication History Panel
- Replication History Panel
- Replication History Panel
- Outbound Volume Replication Panel
- Outbound Volume Replication Panel
- Pending Manual Replications in Group Panel
- Pick Tags for Columns Dialog Box
- Pick Tags for Volume Dialog Box
- Pick Volumes Dialog Box
- Pool Disk Space Panel
- Pool Members Panel
- Pool Volumes Panel
- Power Management Panel
- Power Panel
- Power Supplies Panel
- Promote Replica Set of a Volume Wizard
- Promote to Template Volume Wizard
- Protocol Endpoints Access Control List Panel
- PS Series Group Members Panel
- RADIUS Settings Dialog Box
- Remote Replica Containers Panel
- Remote Replicas Panel
- Remote Replicas Panel
- Remote Replicas Panel
- Remote Replicas Panel (Outbound Collections)
- Remote Replicas Panel (Outbound Collections)
- Remote Replicas Panel (Outbound)
- Remote Replicas Panel (Outbound)
- Remote Replicas Panel
- Rename NAS Cluster Dialog Box
- Inbound Replicas Panel
- Replicas Panel (Inbound Collection)
- Replicas Panel (Inbound Template Replicas)
- Replicas Panel (Inbound)
- Replicate Recovery Container Dialog Box
- Replication Partners Panel
- Replication Progress Panel
- Replication Progress Panel
- Replication Schedules Panel
- Replication Summary Panel
- Replication Summary Panel
- Replication Summary Panel
- Replication Summary Panel
- Replication Summary Panel
- Replication Summary Panel (Template Volumes)
- Resize NAS Reserve Dialog Box
- Restore NAS Container Message
- Resume Data Transfer Wizard
- SAN Headquarters Panel
- SAN Network Panel
- Schedules Summary Panel (Volume Collections)
- Schedules Summary Panel (Volumes)
- Session Banner Dialog Box
- Session Security Panel
- Set Access Type Dialog Box
- Sideplanes Panel
- SMB Home Shares Information Panel
- Snapshot and Replication Schedules Panel (Volume Collections)
- Snapshot and Replication Schedules Panel (Volumes)
- Snapshot Collection Status Panel
- Snapshot iSCSI Settings Panel
- Snapshot Schedules Panel
- Snapshot Summary Panel
- Snapshot Summary Panel
- Snapshots Panel
- Snapshots Panel
- Snapshots Panel
- Software Update Notifications Panel
- Start Compression Dialog Box
- Storage Container Panel
- General Container Information
- Container Space Information
- Storage Pools and Group Members Panel
- Storage Pools Panel
- SyncRep Panel
- Targets Panel
- Temperature Sensors Panel
- General Template Replica Set Information Panel
- Test Partnership Dialog Box
- Test AD Settings Dialog Box
- Thin Clone Replica Sets Panel
- Thin Clones Summary Panel
- Thin Provisioning Settings Panel
- Traps Panel
- UNIX Authentication Panel
- UNIX Authentication Server Configuration Dialog Box
- Update Firmware Dialog Box
- Updates Panel
- Update Using Dell Storage Update Manager (Member Firmware Update Dialog Box)
- User Mapping Panel
- VDS/VSS Access Control List Panel
- VMware Group Access Panel
- VMware Overview Panel
- Volume and Snapshot Space Panel
- Volume Collections Panel
- Volume iSCSI Settings Panel
- Volume Recovery Bin Dialog Box
- Volume Replication Status Panel
- Volume Settings Panel
- Volumes Panel and Folder Information Panel

To delete counter sets:
1. In the Performance Monitor window, click Add statistics.
2. In the Select Statistics dialog box, click Counter sets.
3. In the Counter Set Management dialog box, select the counter set that you want to delete.
4. Click the Delete link.
5. In the Delete Counter Set Conrmation dialog box, click Yes.
Change How Data Is Displayed
Table 54. Changing How Data Is Displayed shows the icons that you use to change the data display. You can view the data as a
chart, a histogram (bar graph), or a data table.
Table 54. Changing How Data Is Displayed
Icon Data Format Options
Chart (line graph)
Displays data on a linear scale
Displays data on a logarithmic scale
Resizes the display (scales in or out to t)
Histogram (bar graph)
Data table None
NOTE: The display mode that you select applies to all panels currently open in the Performance Monitor window.
Display Data for a Specic Point in Time
In the chart view (for both linear and logarithmic scales), when you click inside the data window, the cursor changes to a crosshair.
You can click at any place along the graph to display the details for that time slice.
For example, you can click the crosshairs on the peak of a graph line to display the data for that moment in time in the panel on the
left (see Figure 35. Performance Monitor – Select Data Point). In this example, at the peak of the graph, the group is processing 303
output requests.
330
About Monitoring