
Specifications


A Principled Technologies test report 3
The datacenter in a box performance test: Comparing Dell and HP
blade solutions
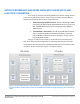
Our testing had three components: first, we examined the setup process for
both solutions, recording the number of steps involved and the time required to
complete them. Next, we tested the performance of both solutions while running a
mixed workload including email, database, and collaboration applications. Finally, we
compared the amount of power the two solutions used while performing the workloads.
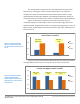
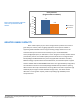
Figures 2 and 3 present comparisons of the factors we tested. They use
normalized comparisons, which assigns a value of 1.0 to the HP storage solution and
expresses the Dell storage solution’s results as a relative percentage greater or lesser. As
Figure 2 shows, the Dell solution took 55.6 percent fewer major steps, and 81.6 percent
less time to set up.
Figure 2. Compared to the HP
solution, the Dell solution took
less time and many fewer steps to
set up.
0.0
0.5
1.0
1.5
Number of major steps Time
Normalized comparison of setup process
(lower numbers are better)
Dell
solution
HP
solution
55% fewer
major steps
81% less
time
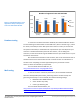
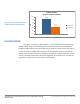
As Figure 3 shows, the Dell solution delivered 40.2 percent greater performance
and supported 48.1 percent more users and 42.7 percent more users per watt.
Figure 3. Compared to the HP
solution, the Dell solution
delivered greater performance,
supported more users and more
users per watt.
0.0
0.5
1.0
1.5
2.0
Performance (IOPS) Number of users supported Number of users per watt
Normalized comparison of performance, users supported, and
users per watt (higher numbers are better)
Dell
solution
HP
solution
40% more
IOPS
48% more
users
42% more users per
watt