
Specifications


A Principled Technologies test report 7
The datacenter in a box performance test: Comparing Dell and HP
blade solutions
Collaboration testing
To simulate the traffic of SharePoint Server 2010 users, we used the WSSDW
1.0.0.0 Beta test. This test creates sample data, populates the server with it, and
simulates SharePoint Server users completing everyday tasks.
We used Visual Studio 2010 to execute the test workload, generating a realistic
user workload where each of the simulated heavy users performed a task every minute.
To do this, we set up the test to run 200 and 134 Visual Studio virtual users with an 8-
second think time in between each of the various tasks, to simulate 1,500 users for the
Dell solution and 1,005 users for the HP solution, respectively. The virtual user count
here was set to match the Exchange user count. The test workload then reports
throughput in tests per second.
For more details about SharePoint Server, see http://office.microsoft.com/en-
us/sharepoint-server-help/.
Detailed performance findings
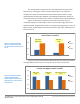
In our testing, we used the read latency of each storage solution while running
the three applications to determine how many users each solution could support.
Typically, read latency should not exceed 20ms, so we used this as our threshold to
determine acceptable performance. A short response time is an important measure of
performance—it means that the users need to wait less time for the server to complete
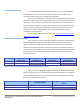
a task. Figure 6 shows the average read and write latency in milliseconds, for the two
solutions under test.
Read latency
(milliseconds)
Percentage decrease
from HP solution
Write latency
(milliseconds)
Percentage decrease
from HP solution
Dell solution
11.7
41.5%
5.1
64.8%
HP solution
20.0
14.5
Figure 6. Read and write latency for the two solutions. Lower numbers are better.
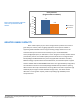
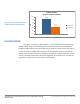
Figure 7 shows the average throughput in IOPS each of the solutions delivered.
We conducted three test runs, and present the results from the median run. As Figure 7
shows, the Dell datacenter in a box solution increased overall throughput over the HP
solution by an average of 40.2 percent.
Throughput (IOPS)
Average percentage increase over HP
solution
Dell solution
1,747.9
40.2%
HP solution
1,246.4
Figure 7. Median throughput for the three applications running on the solutions. Higher numbers are better.