
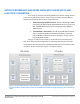
Specifications


A Principled Technologies test report 8
The datacenter in a box performance test: Comparing Dell and HP
blade solutions
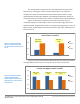
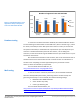
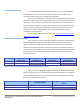
Figure 8 shows the number of users each solution supported while delivering an
acceptable read latency averaging less than 20ms for end users. The number of SQL
Server users supported, in this case, is determined by assuming that a user would
generate four SQL Server transactions per minute.
Users
Percentage increase over HP solution
SQL Server
Dell solution
1,439
45.1%
HP solution
992
Exchange
Dell solution
1,500
50.0%
HP solution
1,000
SharePoint
Dell solution
1,500
49.3%
HP solution
1,005
Total across applications
Dell solution
4,439
48.1%
HP solution
2,997
Figure 8. Number of users the solutions supported. Higher numbers are better.
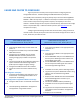
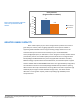
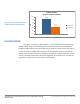
SUPPORT MORE USERS PER WATT
As Figure 9 shows, the two solutions consumed roughly the same amount of
power while performing the performance workloads described above, even though the
Dell solution supported as many as 1.5 times as many users. This translates to a users-
per-watt advantage of 42.7 percent for the Dell datacenter in a box solution. (See Figure
10.)
Percentage increase over HP solution
Watts used
Dell solution
1,263
4.0%
HP solution
1,214
Total number of users
Dell solution
4,439
48.1%
HP solution
2,997
Users per watt
Dell solution
1.17
42.7%
HP solution
0.82
Figure 9. Number of users per watt the solutions supported.