
Administrator Guide

5 0 0 0 0 0
6 0 0 0 0 0
7 0 0 0 0 0
8 0 0 0 0 0
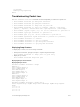
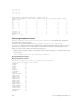
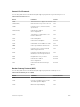
Z9000-B4#show hardware stack-unit 0 drops unit 2
UserPort PortNumber Ingress Drops IngMac Drops Total Mmu Drops EgMac Drops
Egress Drops
64 1 0 0 0 0 0
65 2 0 0 0 0 0
66 3 0 0 0 0 0
67 4 0 0 0 0 0
68 5 0 0 0 0 0
69 6 0 0 0 0 0
70 7 0 0 0 0 0
...
Internal 39 0 0 0 0 0
Internal 40 0 0 0 0 0
Internal 41 0 0 0 0 0
value = 0 = 0x0
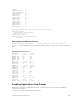
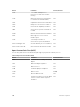
Displaying Dataplane Statistics
The show hardware stack-unit cpu data-plane statistics command provides insight into
the packet types coming to the CPU.
As shown in the following example, the show hardware stack-unit cpu data-plane
statistics command output has been augmented, providing detailed RX/TX packet statistics on a per-
queue basis. The objective is to see whether CPU-bound traffic is internal (so-called party bus or IPC
traffic) or network control traffic, which the CPU must process.
• Display input and output statistics on the party bus, which carries inter-process communication traffic
between CPUs.
show hardware stack-unit cpu party-bus statistics
Displaying Dataplane Statistics
Displaying Party Bus Statistics
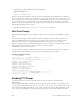
Dell#show hardware stack-unit 0 cpu data-plane statistics
bc pci driver statistics for device:
rxHandle :0
noMhdr :0
noMbuf :0
noClus :0
recvd :0
dropped :0
recvToNet :0
rxError :0
rxDatapathErr :0
rxPkt(COS0) :0
rxPkt(COS1) :0
rxPkt(COS2) :0
rxPkt(COS3) :0
rxPkt(COS4) :0
rxPkt(COS5) :0
rxPkt(UNIT0) :0
rxPkt(UNIT1) :0
rxPkt(UNIT2) :0
rxPkt(UNIT3) :0
transmitted :0
txRequested :0
noTxDesc :0
922
Z-Series Debugging and Diagnostics