
White Papers
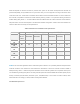
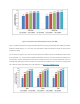
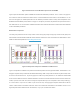
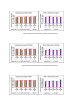
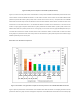
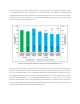
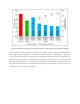
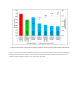

Figure 2: Performance of Intel Broadwell processors with NAMD
Figure 2 plots the simulation speed of NAMD benchmarks with Broadwell processors. The “X” value in the graph on
top of each bar show the performance relative to the 12 core Broadwell processor (which is set as baseline, 1.0). As
seen from the graph, the relative performance of the different processors models is nearly same irrespective of the
NAMD benchmark dataset (small, medium or large). For the top bin processor, the performance improvement is 81 to
84% faster than the 12 core processor. NAMD benchmarks show significant performance improvement with additional
cores for Broadwell processors.
BIOS Profiles comparison
This study was performed with all snoop modes: Home Snoop (HS), Early Snoop (ES), Cluster-on-Die (COD) and
Opportunistic Snoop Broadcast (OSB) with System Profiles “Performance” and “Performance Per-Watt (DAPC)”. More
details on these BIOS profiles are in first blog of this series.
Figure 3: BIOS profile comparison with WRF for CONUS 2.5 km
Figure 3 compares the available snoop modes and two BIOS profiles for the large WRF dataset “CONUS2.5km”. The
left graph compares snoop modes with the default BIOS setting “OSB” snoop mode with “DAPC” System Profile, which
is shown as the red line set at 1. As per the graph, the COD snoop mode performs 2 to 3% better than default OSB
snoop mode. As WRF is a memory sensitive application, the ES snoop mode performance is less than the other snoop
modes, up to 8% lower at 22 cores, due to having less request tokens per core compared to other snoop modes (e.g.
for 14 core 128/14 = 9 per core vs. 128/22 = 5 per core for 22 core). The right graph compares “Performance” with the
“DAPC” system profile for the better performing “COD” snoop mode with COD.DAPC as the baseline. There is not a
significant performance difference with “Performance,” only up to 1% better than “DAPC”.