
White Papers

Ready Solutions Engineering Test Results
Copyright © 2017 Dell Inc. or its subsidiaries. All Rights Reserved. Dell, EMC, and other trademarks are trademarks of Dell Inc. or its subsidiaries. Other trademarks may be
the property of their respective owners. Published in the USA. Dell EMC believes the information in this document is accurate as of its publication date. The information is
subject to change without notice.
1
NAMD Performance Analysis on Skylake
Architecture
Author: Joseph Stanfield
The purpose of this blog is to provide a comparative performance analysis of the Intel® Xeon® Gold 6150 processor and the previous
generation Xeon® E5-2697 v4 processors using the NAMD benchmark. The Xeon® Gold 6150 CPU features 18 physical cores or 36
logical cores when utilizing hyper threading. This processor is based on Intel’s new micro-architecture codenamed “Skylake”. Intel
significantly increased the L2 cache per core from 256 KB on Broadwell to 1 MB on Skylake. The 6150 also touts 24.75 MB of L3 cache
and a six channel DDR4 memory interface.
Nanoscale Molecular Dynamics (NAMD) is an application developed using the Charm++ parallel programming model for molecular
dynamics simulation. It is popular due to its parallel efficiency, scalability, and the ability to simulate millions of atoms.
.
Test Cluster Configurations:
Dell EMC PowerEdge
C6420
Dell EMC PowerEdge C6320
CPU
2x Xeon® Gold 6150 18c 2.7 GHz
(Skylake)
2x Xeon® E5-2697 v4 16c 2.3 GHz
(Broadwell)
RAM
12x 16GB @2666 MHz 8x 16GB @2400 MHz
HDD
1TB SATA 1 TB SATA
OS
RHEL 7.3 RHEL 7.3
InfiniBand
EDR ConnectX-4 EDR ConnectX-4
CHARM++
6.7.1
NAMD
2.12_Source
BIOS Options
Settings
System Profile
Performance Optimized
Logical Processor
Disabled
Virtualization Technology
Disabled
The benchmark dataset selected for this series of tests was the Satellite Tobacco Mosaic Virus, or STMV. STMV contains 1,066,628
atoms, which makes it ideal for demonstrating scaling to large clustered environments. The performance is measured in nanoseconds
per day (ns/day), which is the number of days required to simulate 1 nanosecond of real-time. A larger value indicates faster performance.
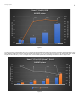
The first series of benchmark tests conducted were to measure the CPU performance. The test environment consisted of a single node,
two nodes, four nodes, and eight nodes with the NAMD STMV dataset run three times for each configuration. The network interconnect
between the nodes used was EDR InfiniBand as noted in the table above. Average results from a single node showed 0.70 ns/day. While
for a two-node run performance increased by 80% to 1.25 ns/days. The trend of an average of 80% increase in performance for each
doubling of node count remained relatively consistent as the environment was scaled to eight nodes, as seen in Figure 1.