
User's Manual

Recovering and Troubleshooting the Managed Server 215
If you entered 0 leave the LED flashing, follow these steps to disable it:
1
Click
System
→
Remote Access
→
iDRAC
→
Troubleshooting
.
2
On the
Identify
page, uncheck the value box next to
Identify Server
.
3
Click
Apply.
Using the Diagnostics Console
The iDRAC provides a standard set of network diagnostic tools (see
Table 13-12) that are similar to the tools included with Microsoft
®
Windows
®
or Linux-based systems. Using the iDRAC Web interface, you can
access the network debugging tools.
To access the Diagnostics Console page, perform the following steps:
1
Click
System
→
iDRAC
→
Troubleshooting
.
2
Click the
Diagnostics
tab.
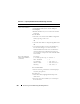
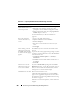
Table 13-12 describes the commands that can be entered on the Diagnostics
Console page. Type a command and click Submit. The debugging results
appear in the Diagnostics Console page.
Click the Clear button to clear the results displayed by the previous
command.
To refresh the Diagnostics Console page, click Refresh.
Table 13-12. Diagnostic Commands
Command Description
arp Displays the contents of the Address Resolution Protocol
(ARP) table. ARP entries may not be added or deleted.
ifconfig Displays the contents of the network interface table.
netstat Prints the content of the routing table.
ping <IP Address> Verifies that the destination IP address is reachable from the
iDRAC with the current routing-table contents. A
destination IP address must be entered in the field to the
right of this option. An Internet control message protocol
(ICMP) echo packet is sent to the destination IP address
based on the current routing-table contents.