
Users Guide


When you import the Dell MD Storage Array Management Pack (Scalable) into the OpsMgr console, the management pack
scans the IP listing le at scheduled intervals to discover and monitor the Dell PowerVault MD Storage Arrays. The default
schedule is 24 hours.
NOTE: You can discover additional Dell PowerVault MD Storage devices by launching the Dell Discovery Utility. You
can also launch the Dell Discovery Utility as a task. For more information, see Launching the Dell Discovery Utility
from the OpsMgr console.
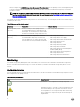
The Dell MD Storage Array Management Pack performs two levels of discovery. The following lists the discoveries and the objects
created by the discoveries.
Table 3. Discovery and the objects created
Discovery Description Objects Created
MD Storage Array Seed
Discovery
Creates seed objects after getting the Dell
PowerVault MD Array device IP details from the
IP listing le. The seed objects are used to initiate
the Dell PowerVault MD Storage Array Discovery.
MD Storage Array seed device.
MD Storage Array
Discovery
Discovers hardware components for the Dell
PowerVault MD storage arrays. The discovery
uses the ABB toolset to contact the device and
fetch the device inventory and failure information.
• MD Storage Array Battery
• MD Storage Array Power Supply
• MD Storage Array RAID Controller Module
• MD Storage Array Enclosure
• MD Storage Array Fan
• MD Storage Array Physical Disk
• MD Storage Array Virtual Disk
• MD Storage Array Enclosure Management
Modules (EMM) Group
• MD Storage Array Current Conguration
• MD Storage Array Chassis
• MD Storage Array Network Interfaces
Monitoring
The Dell MD Storage Array Management Pack Suite enables you to monitor the discovered Dell PowerVault MD Storage Array
devices. The health status indicators help you to monitor the health of your Dell PowerVault MD Storage Array devices on the
network.
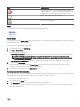
Health status indicators
The following table lists the icons that indicate the health status of the discovered Dell PowerVault MD Storage Array devices and
their components in the OpsMgr console.
Table 4. Severity level indicators
Icon Severity Level
Normal/OK — The component is working as expected.
Warning/Noncritical — A probe or other monitoring device has
detected a reading for the component that is above or below
the acceptable level. The component may still be functioning,
but it could fail. The component may also be functioning in an
impaired state.
8