
Users Guide

Displaying Show sFlow on a Stack-unit
To view sFlow statistics on a specified Stack-unit, use the following command.
• Display sFlow configuration information and statistics on the specified interface.
EXEC mode
show sflow stack—unit slot-number
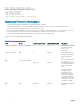
Example of Viewing sFlow Configuration (Line Card)
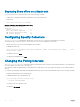
Dell#show sflow Stack-unit 1
Stack-unit 1
Samples rcvd from h/w :0
Total UDP packets exported :0
UDP packets exported via RPM :0
UDP packets dropped :36
Configuring Specify Collectors
The sflow collector command allows identification of sFlow collectors to which sFlow datagrams are forwarded.
You can specify up to two sFlow collectors. If you specify two collectors, the samples are sent to both.
• Identify sFlow collectors to which sFlow datagrams are forwarded.
CONFIGURATION mode
sflow collector ip-address agent-addr ip-address [number [max-datagram-size number] ] | [max-
datagram-size number ]
The default UDP port is 6343.
The default max-datagram-size is 1400.
Changing the Polling Intervals
The sflow polling-interval command configures the polling interval for an interface in the maximum number of seconds between
successive samples of counters sent to the collector.
This command changes the global default counter polling (20 seconds) interval. You can configure an interface to use a different polling
interval.
To configure the polling intervals globally (in CONFIGURATION mode) or by interface (in INTERFACE mode), use the following command.
• Change the global default counter polling interval.
CONFIGURATION mode or INTERFACE mode
sflow polling-interval interval value
• interval value: in seconds.
The range is from 15 to 86400 seconds.
The default is 20 seconds.
768
sFlow