
Administrator Guide
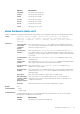
Version Description
9.8(0.0P2) Introduced on the S3048-ON.
9.7(0.0) Introduced on the S6000-ON.
9.0.2.0 Introduced on the S6000.
8.3.19.0 Introduced on the S4820T.
8.3.11.0 Introduced on the Z9000.
8.3.7.0 Introduced on the S4810.
7.8.1.0 Introduced on the S-Series.
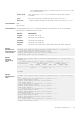
show hardware stack-unit
Display the data plane or management plane input and output statistics of the designated component of the designated stack member.
Syntax
stack-unit stack-unit-number {cpu data-plane statistics | cpu management
statistics | [ drops [unit number | fpga register | party-bus statistics |
stack-port | ti-monitor | unit 0-1 {counters | details | port-stats [detail] |
register}}
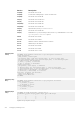
Parameters
stack-unit
stack-
unit-number
{command-
option}
Enter the keywords stack-unit to select a particular stack member and then enter
one of the following command options to display a collection of data based on the option
entered. The range is from 1 to 12.
cpu data-plane
statistics
Enter the keywords cpu data-plane statistics then the keywords stack
port and its number, from 1 to 52 to display the data plane statistics, which shows the
High Gig (Higig) port raw input/output counter statistics to which the stacking module
is connected.
cpu management
statistics
Enter the keywords cpu management statistics to display the counters of the
management port.
cpu party-bus
statistics
Enter the keywords cpu party-bus statistics, to display the Management plane
input/output counter statistics of the pseudo party bus interface.
cpu sata-interface
statistics
Enter the keywords cpu sata-interface statistics to display the sata
interface error counter statistics.
drops [unit
unit-
number
]
Enter the keyword drops to display internal drops on the selected stack member. Enter
the optional keyword unit unit-number to display the internal drop counters of the
specified port pipe.
fpga register Enter the keyword to display the register value of the fpga register.
unit
unit-number
{counters | details
| port-stats
[detail] | register}
Enter the keyword unit then a number and then enter one of the keywords to
troubleshoot errors on the selected port-pipe and to give status on why a port is not
coming up to register level.
TI monitor Enter the unit keyword to show information regarding the TI register.
Defaults None
Command Modes
• EXEC
• EXEC Privilege
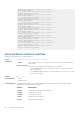
Command History
This guide is platform-specific. For command information about other platforms, see the relevant Dell EMC
Networking OS Command Line Reference Guide.
Version Description
9.10(0.1) Introduced on the S6010-ON and S4048T-ON.
Debugging and Diagnostics 471