
Users Guide
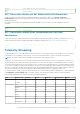
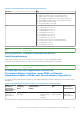
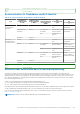
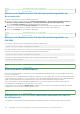
Table Of Contents
- Benutzerhandbuch für Integrated Dell Remote Access Controller 9
- Inhaltsverzeichnis
- Übersicht über den iDRAC
- Vorteile der iDRAC-Verwendung
- Wichtige Funktionen
- Neue Funktionen hinzugefügt
- Verwendung dieses Benutzerhandbuchs
- Unterstützte Web-Browser
- iDRAC-Lizenzen
- Lizenzierte Funktionen in iDRAC9
- Schnittstellen und Protokoll für den Zugriff auf iDRAC
- iDRAC-Schnittstelleninformationen
- Weitere nützliche Dokumente
- Kontaktaufnahme mit Dell
- Zugriff auf Dokumente der Dell Support-Website
- Zugriff auf Redfish API-Handbuch
- Anmelden bei iDRAC
- Kennwortänderung erzwingen (FCP)
- Anmeldung bei iDRAC mit OpenID Connect
- Anmelden als lokaler Benutzer, Active Directory-Nutzer oder LDAP-Nutzer bei iDRAC
- Bei iDRAC über eine Smartcard als lokaler Nutzer anmelden
- Bei iDRAC über die einmalige Anmeldung anmelden
- Über Remote-RACADM auf iDRAC zugreifen
- Über lokalen RACADM auf iDRAC zugreifen
- Über Firmware-RACADM auf iDRAC zugreifen
- Einfache Zwei-Faktor-Authentifizierung (einfache 2FA)
- RSA SecurID 2FA
- Systemzustand anzeigen
- Anmeldung beim iDRAC mit Authentifizierung mit öffentlichem Schlüssel
- Mehrere iDRAC-Sitzungen
- Standardkennwort sichern
- Lokales Zurücksetzen des standardmäßigen iDRAC-Kennworts
- Zurücksetzen des Standardkennworts mithilfe des Dienstprogramms für die iDRAC-Einstellungen
- Zurücksetzen des Standardkennwort mittels lokalem RACADM
- Standardmäßiges Kennwort unter Verwendung von OpenManage Mobile wiederherstellen
- Zurücksetzen des Standardkennworts mithilfe der USB-Serververwaltungsschnittstelle
- Ändern des Standardkennworts unter Verwendung von USB-NIC
- Wiederherstellen des iDRAC-Standardkennworts im Remote-Zugriff
- Lokales Zurücksetzen des standardmäßigen iDRAC-Kennworts
- Ändern des standardmäßigen Anmeldekennworts
- Aktivieren oder Deaktivieren der standardmäßigen Kennwortwarnungsmeldung
- Richtlinie zur Kennwortsicherheit
- IP-Blockierung
- Aktivieren und Deaktivieren des Betriebssystems zum iDRAC-Passthrough unter Verwendung der Web-Schnittstelle
- Warnungen über RACADM aktivieren oder deaktivieren
- Managed System einrichten
- iDRAC-IP-Adresse einrichten
- iDRAC-IP-Adresse über das Dienstprogramm für die iDRAC-Einstellungen einrichten
- iDRAC-IP-Adresse über die CMC-Webschnittstelle einrichten
- Auto-Ermittlung
- Konfigurieren von Servern und Serverkomponenten mithilfe der automatischen Konfiguration
- Verwenden von Hash-Kennwörtern für mehr Sicherheit
- Einstellungen für lokales Administratorkonto ändern
- Standort für das Managed System einrichten
- Systemleistung und Stromverbrauch optimieren
- Management Station einrichten
- Konfigurieren von unterstützten Webbrowsern
- Internet Explorer konfigurieren
- Konfiguration von Mozilla Firefox
- Web-Browser für die Verwendung der virtuellen Konsole konfigurieren
- Internet Explorer zur Verwendung des HTML-5-basierten Plug-In konfigurieren
- Konfigurieren von Internet Explorer für Verwendung des HTML5-basierten Plug-ins
- Web-Browser für die Verwendung des Java-Plugin konfigurieren
- IE für die Verwendung des ActiveX-Plugin konfigurieren
- Zertifizierungsstellenzertifikate auf die Management Station importieren
- Lokalisierte Versionen der Webschnittstelle anzeigen
- Aktualisieren der Gerätefirmware
- Firmware über die iDRAC-Webschnittstelle aktualisieren
- Planung automatischer Firmware-Aktualisierungen
- Aktualisieren der Gerätefirmware über RACADM
- Firmware über die CMC-Web-Schnittstelle aktualisieren
- Firmware über DUP aktualisieren
- Firmware über Remote-RACADM aktualisieren
- Firmware über die Lifecycle-Controller-Remote-Dienste aktualisieren
- Aktualisieren der CMC-Firmware über iDRAC
- Anzeigen und Verwalten von gestuften Aktualisierungen
- Rollback der Geräte-Firmware durchführen
- Rollback für die Firmware über die iDRAC-Webschnittstelle durchführen
- Rollback der Firmware über die CMC-Web-Schnittstelle durchführen
- Rollback der Firmware über RACADM durchführen
- Rollback der Firmware über Lifecycle-Controller durchführen
- Rollback der Firmware über die Remote-Dienste für den Lifecycle Controller durchführen
- iDRAC wiederherstellen
- iDRAC über andere Systemverwaltungs-Tools überwachen
- Unterstützung des Serverkonfigurationsprofils – Import und Export
- Sichere Startfunktion-Konfiguration über BIOS-Einstellungen oder F2
- BIOS recovery
- iDRAC-IP-Adresse einrichten
- iDRAC konfigurieren
- iDRAC-Informationen anzeigen
- Netzwerkeinstellungen ändern
- Chiffresammlungs-Auswahl
- Modus FIPS (Konfiguration)
- Dienste konfigurieren
- Verwenden des VNC-Client für die Remote-Server-Verwaltung
- Anzeige auf der Frontblende konfigurieren
- Das Konfigurieren von Zeitzone und NTP
- Erstes Startlaufwerk einstellen
- Aktivieren oder Deaktivieren des Betriebssystems zum iDRAC-Passthrough
- Unterstützte Karten für Betriebssystem-zu-iDRAC-Passthrough
- Unterstützte Betriebssysteme für USB-NIC
- Aktivieren und Deaktivieren des Betriebssystems zum iDRAC-Passthrough unter Verwendung der Web-Schnittstelle
- Aktivieren und Deaktivieren des Betriebssystems zum iDRAC-Passthrough unter Verwendung von RACADM
- Aktivieren oder Deaktivieren des Betriebssystems zum iDRAC-Passthrough unter Verwendung des Dienstprogramms für iDRAC-Einstellungen
- Zertifikate abrufen
- SSL-Serverzertifikate
- Neue Zertifikatsignierungsanforderung erstellen
- Automatische Zertifikatregistrierung
- Serverzertifikat hochladen
- Serverzertifikat anzeigen
- Hochladen eines benutzerdefinierten Signaturzertifikats
- Benutzerdefiniertes SSL-Zertifikat Signierungszertifikat herunterladen
- Benutzerdefiniertes SSL-Zertifikat Signierungszertifikat löschen
- Mehrere iDRACs über RACADM konfigurieren
- Zugriff zum Ändern der iDRAC-Konfigurationseinstellungen auf einem Host-System deaktivieren
- Delegierte Autorisierung mithilfe von OAuth 2.0
- Anzeigen von Informationen zu iDRAC und zum Managed System
- Zustand und Eigenschaften des Managed System anzeigen
- Konfigurieren der Assetnachverfolgung
- System-Bestandsaufnahme anzeigen
- Sensorinformationen anzeigen
- Überwachen des Leistungsindex für CPU, Arbeitsspeicher und Eingabe-/Ausgabemodule
- Erkennung inaktiver Server
- GPU-Verwaltung (Beschleuniger)
- Das System auf Frischlufttauglichkeit überprüfen
- Temperaturverlaufsdaten anzeigen
- Anzeigen der auf dem Host-Betriebssystem verfügbaren Netzwerkschnittstellen
- Anzeigen der auf dem Host-Betriebssystem verfügbaren Netzwerke über RACADM
- Verbindungen der FlexAddress-Mezzanine-Kartenarchitektur anzeigen
- Anzeigen und Beenden von iDRAC-Sitzungen
- Einrichten der iDRAC-Kommunikation
- Mit iDRAC über eine serielle Verbindung über ein DB9-Kabel kommunizieren
- BIOS für serielle Verbindung konfigurieren
- Serielle RAC-Verbindung aktivieren
- Grundlegenden seriellen IPMI-Verbindungs- und -Terminalmodus aktivieren
- Von der seriellen RAC-Verbindung auf die serielle Konsolenverbindung bei Verwendung eines DB9-Kabels umschalten
- Mit iDRAC über IPMI SOL kommunizieren
- Mit iDRAC über IPMI über LAN kommunizieren
- Remote-RACADM aktivieren oder deaktivieren
- Lokalen RACADM deaktivieren
- IPMI auf Managed System aktivieren
- Linux während des Starts in RHEL 6 für die serielle Konsole konfigurieren
- Konfigurieren des seriellen Terminals in RHEL 7
- Unterstützte SSH-Verschlüsselungssysteme
- Mit iDRAC über eine serielle Verbindung über ein DB9-Kabel kommunizieren
- Benutzerkonten und Berechtigungen konfigurieren
- iDRAC-Benutzerrollen und -Berechtigungen
- Empfohlene Zeichen in Benutzernamen und Kennwörtern
- Lokale Benutzer konfigurieren
- Konfigurieren von Active Directory-Nutzern
- Voraussetzungen für die Verwendung der Active Directory-Authentifizierung für iDRAC
- Unterstützte Active Directory-Authentifizierungsmechanismen
- Übersicht des Standardschema-Active Directory
- Active Directory-Standardschema konfigurieren
- Übersicht über Active Directory mit erweitertem Schema
- Active Directory mit erweitertem Schema konfigurieren
- Erweitern des Active Directory-Schemas
- Dell-Erweiterung zu Active Directory Benutzer- und Computer-Snap-In installieren
- iDRAC-Benutzer und -Berechtigungen zu Active Directory hinzufügen
- Erstellen von iDRAC-Geräteobjekten
- Berechtigungsobjekt erstellen
- Zuordnungsobjekt erstellen
- Benutzerzugriffsberechtigungen für verknüpfte Objekte bereitstellen
- Objekte zu einem Zuordnungsobjekt hinzufügen
- Benutzer oder Benutzergruppen hinzufügen
- Berechtigungen hinzufügen
- Hinzufügen von iDRAC-Geräten oder iDRAC-Gerätegruppen
- Active Directory mit erweitertem Schema unter Verwendung der iDRAC-Webschnittstelle konfigurieren
- Konfiguration des Active Directory mit erweitertem Schema unter Verwendung von RACADM
- Active Directory-Einstellungen testen
- Generische LDAP-Benutzer konfigurieren
- Systemkonfigurations-Sperrmodus
- iDRAC für die einfache Anmeldung oder Smart Card-Anmeldung konfigurieren
- Voraussetzungen für die einmalige Active Directory-Anmeldung oder die Smart Card-Anmeldung
- iDRAC-SSO-Anmeldung für Active Directory-Benutzer konfigurieren
- Smartcard-Anmeldung aktivieren oder deaktivieren
- Konfigurieren von Smart Card-Anmeldung
- Anmelden mit Smart Card
- iDRAC für das Versenden von Warnungen konfigurieren
- Warnungen aktivieren und deaktivieren
- Warnungen filtern
- Ereigniswarnungen einrichten
- Alarmwiederholungsereignis einrichten
- Ereignismaßnahmen festlegen
- Einstellungen für E-Mail-Warnungs-SNMP-Trap oder IPMI-Trap konfigurieren
- Konfigurieren von WS-Ereignisauslösung
- Konfigurieren von Redfish-Ereignissen
- Überwachung von Gehäuseereignissen
- IDs für Warnungsmeldung
- iDRAC 9 Group Manager
- Group Manager
- Ansicht „Zusammenfassung“
- Konfigurationsanforderungen des Netzwerks
- Anmeldungen verwalten
- Warnungen konfigurieren
- Exportieren
- Ansicht „Discovered Servers“ (Ermittelte Server)
- Ansicht „Jobs“ (Aufgaben)
- Jobs-Export
- Gruppeninformationsbedienfeld
- Gruppeneinstellungen
- Aktionen für einen ausgewählten Server
- iDRAC-Gruppen-Firmwareupdates
- Protokolle verwalten
- Stromversorgung im iDRAC überwachen und verwalten
- Direkte iDRAC-Updates
- Durchführen einer Bestandsaufnahme, Überwachung und Konfiguration von Netzwerkgeräten
- Bestandsaufnahme für Netzwerkgeräte erstellen und Netzwerkgeräte überwachen
- Bestandsaufnahme und Überwachung von FC-HBA-Geräten
- Bestandsaufnahme und Überwachung von SFP-Transceiver-Geräten
- Telemetry Streaming
- Serielle Datenerfassung
- Dynamische Konfiguration von virtuellen Adressen, Initiator- und Speicherziel-Einstellungen
- Unterstützte Karten für die E/A-Identitätsoptimierung
- Unterstützte NIC-Firmware-Versionen für die E/A-Identitätsoptimierung
- Virtuelle oder Remote-zugewiesene Adresse und Persistenzrichtlinien-Verhalten, wenn iDRAC auf Remote-zugewiesenen Address-Modus oder Konsolenmodus eingestellt ist
- Systemverhalten für FlexAddress und E/A-Identität
- Aktivieren oder Deaktivieren der E/A-Identitätsoptimierung
- SSD-Verschleiß-Schwellenwerte
- Konfigurieren der Einstellungen für die Beständigkeitsrichtlinie
- Verwalten von Speichergeräten
- Zum Verständnis von RAID-Konzepten
- Unterstützte Controller
- Unterstützte Gehäuse
- Übersicht über die unterstützten Funktionen für Speichergeräte
- Bestandsaufnahme für Speichergeräte erstellen und Speichergeräte überwachen
- Anzeigen der Speichergerätetopologie
- Verwalten von physischen Festplatten
- Verwalten von virtuellen Festplatten
- Erstellen von virtuellen Laufwerken
- Bearbeiten von Cache-Richtlinien für virtuelle Laufwerke
- Löschen von virtuellen Festplatten
- Überprüfen der Übereinstimmung der virtuellen Festplatte
- Initialisieren von virtuellen Festplatten
- Verschlüsseln der virtuellen Laufwerke
- Zuweisen oder Aufheben der Zuweisung von dezidierten Hotspares
- Verwalten von virtuellen Festplatten über die Webschnittstelle
- Verwalten von virtuellen Festplatten über RACADM
- RAID-Konfigurationsfunktionen
- Verwalten von Controllern
- Konfigurieren der Controller-Eigenschaften
- Importieren oder automatisches Importieren von Fremdkonfigurationen
- Fremdkonfiguration löschen
- Zurücksetzen der Controller-Konfiguration
- Wechseln des Controller-Modus
- 12-GB/s-SAS-HBA-Adapter-Vorgänge
- Überwachen der voraussagenden Fehleranalyse auf Festplatten
- Controller-Vorgänge im Nicht-RAID-Modus oder HBA-Modus
- Ausführen der RAID-Konfigurations-Jobs auf mehreren Speicher-Controllern
- Manage Preserved Cache (Beibehaltenen Cache verwalten)
- Verwalten von PCIe-SSDs
- Verwalten von Gehäusen oder Rückwandplatinen
- Auswählen des Betriebsmodus zum Anwenden von Einstellungen
- Anzeigen und Anwenden von ausstehenden Vorgängen
- Speicher-Geräte – Szenarien des Anwenden-Vorgangs
- Blinken oder Beenden des Blinkens der Komponenten-LEDs
- Softwareneustart
- BIOS-Einstellungen
- Virtuelle Konsole konfigurieren und verwenden
- Unterstützte Bildschirmauflösungen und Bildwiederholfrequenzen
- Virtuelle Konsole konfigurieren
- Vorschau der virtuellen Konsole
- Virtuelle Konsole starten
- Viewer für virtuelle Konsole verwenden
- eHTML5-basierte virtuelle Konsole
- HTML5-basierte virtuelle Konsole
- Mauszeiger synchronisieren
- Weitergeben aller Tastenanschläge über die virtuelle Konsole für Java- oder ActiveX-Plugin
- Verwenden des iDRAC Service Module
- Verwendung der USB-Schnittstelle für das Server-Management
- Verwenden von Quick Sync 2
- Virtuelle Datenträger verwalten
- Unterstützte Laufwerke und Geräte
- Virtuellen Datenträger konfigurieren
- Auf virtuellen Datenträger zugreifen
- Virtuellen Datenträger über die virtuelle Konsole starten
- Virtuelle Datenträger ohne virtuelle Konsole starten
- Images von virtuellen Datenträgern hinzufügen
- Details zum virtuellen Gerät anzeigen
- Zugriff auf Treiber
- USB-Gerät zurücksetzen
- Virtuelles Laufwerk zuordnen
- Zuordnung für virtuelles Laufwerk aufheben
- Startreihenfolge über das BIOS festlegen
- Einmalstart für virtuelle Datenträger aktivieren
- vFlash SD-Karte verwalten
- Konfigurieren der vFlash-SD-Karte
- vFlash-Partitionen verwalten
- SMCLP verwenden
- Betriebssysteme bereitstellen
- Fehler auf Managed System über iDRAC beheben
- Diagnosekonsole verwenden
- POST-Codes anzeigen
- Videos zum Startvorgang und zur Absturzerfassung anzeigen
- Protokolle anzeigen
- Bildschirm „Letzter Systemabsturz“ anzeigen
- Anzeigen des Systemstatus
- Anzeigen für Hardwareprobleme
- Systemzustand anzeigen
- Serverstatusbildschirm auf Fehlermeldungen überprüfen
- iDRAC-Neustart
- Auf Standardeinstellungen zurücksetzen (RTD)
- Löschen von System- und Nutzerdaten
- Zurücksetzen des iDRAC auf die Standardeinstellungen
- Integration von SupportAssist im iDRAC
- Häufig gestellte Fragen
- System-Ereignisprotokoll
- Benutzerdefinierte Absender-E-Mail-Konfiguration für iDRAC-Warnmeldungen
- Netzwerksicherheit
- Telemetrie-Streaming
- Active Directory
- Einmaliges Anmelden
- Smart Card-Anmeldung
- Virtuelle Konsole
- Virtueller Datenträger
- vFlash-SD-Karte
- SNMP-Authentifizierung
- Speichergeräte
- GPU (Beschleuniger)
- iDRAC-Service-Modul
- RACADM
- Standardkennwort dauerhaft auf „calvin“ setzen
- Verschiedenes
- Anwendungsszenarien
- Fehler auf einem Managed System beheben, auf das nicht zugegriffen werden kann
- Systeminformationen abrufen und Systemzustand bewerten
- Einrichten von Warnungen und Konfigurieren von E-Mail-Warnungen
- Anzeigen und Exportieren des Systemereignisprotokoll und Lifecycle-Protokolls
- Schnittstellen zum Aktualisieren der iDRAC-Firmware
- Ordnungsgemäßes Herunterfahren durchführen
- Neues Administratorbenutzerkonto erstellen
- Starten einer Server-Remote-Konsole und Mounten eines USB-Laufwerks
- Bare Metal-Betriebssystem über verbundenen virtuellen Datenträger und Remote-Dateifreigabe installieren
- Rack-Dichte verwalten
- Neue elektronische Lizenz installieren
- Übernehmen der E/A-Identitätskonfigurationseinstellungen für mehrere Netzwerkkarten bei einem Einzel-Host-System-Neustart

Identifier GUID-56115AB5-7EF2-4FE9-9A7A-F04593E418C4
Version 1
Status Translation Validated
SFP-Transceiver-Geräte mit der Webschnittstelle überwachen
Um die SFP-Transceiver-Geräteinformationen über die Webschnittstelle anzuzeigen, gehen Sie zu System > Übersicht >
Netzwerkgeräte und klicken Sie auf ein bestimmtes Gerät. Weitere Informationen zu den angezeigten Eigenschaften finden Sie in
der iDRAC-Online-Hilfe.
Im Seitennamen wird auch die Steckplatznummer angezeigt, die angibt, wo das FC-Transceiver-Gerät verfügbar ist, unter Port-
Statistiken.
Identifier GUID-D5549593-D0D6-4EAD-91E5-F93BCF1876E7
Version 1
Status Translation Validated
SFP-Transceiver-Geräte unter Verwendung von RACADM
überwachen
Um die SFP-Transceiver-Geräteinformationen unter Verwendung von RACADM anzuzeigen, verwenden Sie den Befehl hwinventory.
Weitere Informationen finden Sie im iDRAC-RACADM-CLI-Handbuch verfügbar unter https://www.dell.com/idracmanuals.
Identifier
GUID-BB333215-C6B3-481A-A508-14C90412F4CB
Version 7
Status Released
Telemetry Streaming
Telemetry enables users to collect and stream real-time device metrics, events, and data logs from a PowerEdge server to a subscribed
external client or server application. Using Telemetry, you can set the type and frequency of reports that needs to be generated.
NOTE: The feature is supported on all the platforms and it requires iDRAC Datacenter license.
Telemetry is one-to-many solution for collecting and streaming the live system data from one or more PowerEdge servers (iDRAC) to a
centralized 'Remote Server Monitoring, Analysis, and Alerting service'. The feature also supports on-demand data collection of the data.
The telemetry data includes metrics/inventory and logs/events. The data can be streamed (pushed out) or collected (pulled) from iDRAC
to or by remote consumers like Redfish client and Remote Syslog Server. The telemetry data is also provided to the iDRAC SupportAssist
data collector on demand. The data collection and report is based on predefined Redfish telemetry metrics, trigger, and report definitions.
The telemetry streaming settings can be configured through RACADM, Redfish, and Server Configuration Profile (SCP).
To configure Telemetry, enable or select the required device reports or logs that define the behavior and frequency of data streaming. Go
to Configuration > System Settings page to configure Telemetry. Data streaming is automatic until the Telemetry is disabled.
Following table describes the metric reports that can be generated using telemetry:
Type
Metric Group Inventory Sensor Statistics Configuration Metrics
I/O Devices NICs No Yes Yes No No
FC HBAs No Yes Yes No No
Server Devices CPUs No Yes No No Yes
Memory No Yes No No Yes
Fans No Yes No No No
PSUs No No No No Yes
Sensors No Yes No No No
Environmental Thermal No Yes No No Yes
Power No No Yes No Yes
Performance No No Yes No No
Durchführen einer Bestandsaufnahme, Überwachung und Konfiguration von Netzwerkgeräten 243