
Owner's Manual

Active Performance Monitor 761
5
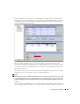
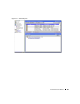
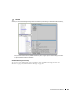
In the
Thresholds
screen, examine existing thresholds by clicking on the listed threshold in
the upper panel, then clicking
Edit.
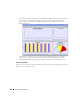
For example
BW Util
(utilized bandwidth) has thresholds
at 90% (High, Critical), 80% (Medium, Warning), and 0% (Low, Cleared). When the data
crosses thresholds, the monitor reacts.
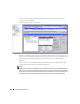
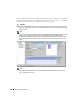
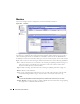
Available attributes depend on the type of monitor you are creating. Notice that if you click
Edit
in the upper
Attribute
panel, you can alter whether crossing this threshold emits a
notification (an alarm that would appear on the Alarm panel), the type of calculation, and so
on. You can even alter existing thresholds, by selecting one, then clicking
Edit
to the right of
the selected threshold.
For the sake of this monitor, we will only examine these capabilities, not alter any thresholds.
Click
Cancel
(twice) to return this screen to its original appearance.
NOTE:
If a threshold’s counter is an SNMP Counter32 (a 32-bit counter) monitoring can exceed its capacity with
a fully utilized gigabit interface in a relatively short period of time. The defaults configured in this monitor
account for this, but if you know that this is an issue, you can probably configure the monitor to account
for it too.
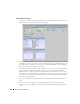
After taking a look at Thresholds no more configuration is required. Notice, however, that you
can also configure
Metrics
on another screen in this editor to calculate additional values based