Dell OpenManage Network Manager Quick Reference Guide
Notes and Cautions A NOTE indicates important information that helps you make better use of your software. A CAUTION indicates potential damage to hardware or loss of data if instructions are not followed. ____________________ Information in this document is subject to change without notice. © 2011 Dell Inc. All rights reserved. Reproduction of these materials in any manner whatsoever without the written permission of Dell Inc. is strictly forbidden.
Contents 1 Quick Start . . . . . . . . . . . . . . . . . . . . . . . . . . . . . . . . . . . . . . . . . . . 5 Introducing OpenManage Network Manager . . . . . . . . . . . . . . . . . . . . . . .5 System Basics . . . . . . . . . . . . . . . . . . . . . . . . . . . 6 Supported Operating System Versions . . . . . . . . . . . . . . . 6 Hardware Recommendations . . . . . . . . . . . . . . . . . . . 7 Basic Network Considerations . . . . . . . . . . . . . . . . . . 7 Authentication . . . . . . . . . . . . . . .
Managing Resources . . . . . . . . . . . . . . . . . . . . . . . . . . . . . . . . . . . . . . . . . . . 28 Alarm Panels . . . . . . . . . . . . . . . . . . . . . . . . . . . . . . . . . . . . . . . . . . . . . . . . . . 29 Alarm Severity & Count . . . . . . . . . . . . . . . . . . . . . . 30 Alarm Manager . . . . . . . . . . . . . . . . . . . . . . . . . . 30 2 Common Tasks . . . . . . . . . . . . . . . . . . . . . . . . . . . . . . . . . . . . . . .33 Managing Layouts . . . . . . . . . . . . . . . . . .
1 Quick Start Introducing OpenManage Network Manager We created this Quick Start Guide to get you started using your OpenManage Network Manager program as quickly and productively as possible. After a review of the hardware and software requirements needed for your installation in System Basics, you can move on to Installation and Startup . To start the first use of the software, consult Discovering Resources . This software includes reporting capabilities.
System Basics System requirements vary depending how you use the application and the operational environment. Because we do not know your specific network and devices, the recommendations are based on typical, not definitive figures, and are as much suggestions as requirements. Base the minimum configuration of any system on its expected peak load. Your installation should spend 95% of its time idle and 5% of its time trying to keep pace with the resource demands.
Hardware Recommendations OpenManage Network Manager contains an Application Server that runs continuously in the background, and a Client (the user interface you actually see). You can start and stop the client portion of the software without impacting the application server. Device monitoring stops when you stop the application server or turn off its host machine. The client can also be on a different machine than the application server.
Authentication For successful discovery of the resources on your network, this software requires authenticated management access to the device. To get this access, you must provide the correct SNMP community strings, and any other command-line (Telnet / SSH) or browser (HTTP/HTTPS) authentication, and SNMP must be turned on, if that is not the device’s default. Some devices require pre-configuration to recognize this management software. Consult your network administrator for this information.
Updating Your License If you have a limited license — for example OpenManage Network Manager by default limits discovery to ten devices — then your application does not function outside those licensed limits. If you purchase additional licenses, put the updated license file in a convenient directory, then use the Settings -> Permissions -> Register License menu item to open a file browser. Locate the license file, and click the Register License button.
Managing Multiple Screens The content of the Main Panel is referred to as a window. Just as you can open several documents in your word processor, you can open several windows in this application. To see the list of windows you have open, click the Window menu. In the Browser View setting, you can see only one active window at a time. You cannot tile or minimize these windows unless you select Multiple Document Interface (MDI) View (the default in OpenManage Network Manager) from the View -> Launcher menu.
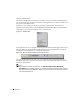
Screen Layouts When you select Resources in the Navigation Panel, for example, the default view looks like Figure 1:4. Figure 1:4. Default View A list of all Equipment and their attributes Navigation Panel Main Panel Detail Panels: Information fo the selected device and associated infrastructure The lower portion of such screens displays detail panels with information about the equipment selected in the upper panel. For details about changing and managing screen layouts, see Managing Layouts .
You can also set up users, device access passwords, and groups for both users and devices, as you begin to use it. For example, use Group Operations to act or schedule operations on multiple devices. Consult the User Guide for details about administration and the many additional discovery, management, and reporting options available with this software beyond those discussed in this Quick Start Guide. NOTE: Best practice is to use the default Admin user unless security concerns dictate otherwise.
7. View the final confirmation of components to install. Click Next. Observe the progress bar as files are copied for installation. 8. The database size typically defaults to 2G with unlimited expansion. Some installations display this default and let you modify it in a database installation screen that appears during this process.
Starting the Client After you verify that the application server is started (in Windows, the monitor icon in the system tray turns green), use the Start button (or its Linux equivalent) to find OpenManage Network Manager among your programs. Click that icon to start the client. In Linux, if you do not see a OpenManage Network Manager icon on your desktop first set the environment in a shell with . /etc/.dsienv ([dot][space][foreslash][dot]dsienv), then type redcell at a command line Figure 1:5.
A login screen appears. The default login user is admin, with a blank password. After logging in as admin, you are prompted to change the password. See the other manuals or online help for more information about options for adding and configuring user privileges and the kind of password constraints that appear on the Change Password dialog. Figure 1:6. Change Password See Screen Layouts for more about managing the user interface. See Troubleshooting Tips to solve application problems.
HTTPS To limit connections to the application server to HTTPS (secure) only, you can use the -e option when starting the application server from the command line, or add the following line to owareapps/ installprops/lib/installed.properties: oware.appserver.web.enable.https=true To force the client to use HTTPS (secure) for web connections to the server add the following line to owareapps/installprops/lib/installed.properties (the same file as above when the client is on the application server).
and click Apply. Then click Add to add the address(es) to the processing queue, or click Remove to delete a previously created range you selected. You can add several such criteria. NOTE: If you are managing in a DNS / DHCP environment, be sure to select Manage by Hostname in the Options tab. For this to be effective, however, the association between hostname and the correct IP address for the discovered equipment must be accurate. 2. New / Edit Authentication.
5. Select Discovery Activities (Listed in Execution Order)—The lower portion of the screen lists activities to perform after discovery. Use the Select Activity field along with the command (...) and search buttons to its right to find activities. Selecting here lets you select from those listed by default, and from those that appear in the Activities Manager. Click Add to list a selected activity below, checked as Selected. Some activities appear automatically (from the default discovery profile).
Auth(s) (validated authentication credentials), and the Auth Status that lets you know whether a device is ready to discover, or has missing or invalid auths. In this last case of missing or invalid credentials, you can click the Change Authentication icon. From left to right, the icons let you select all devices for discovery, unselect them, select and unselect a single device, and change authentications. When you click Change Authentication, a screen like Select Devices for Discovery screen appears.
11. When discovery is done for the user admin, and you click Close, the following Layout screen appears by default. Alarms: Totals followed by a list of alarms from the discovered devices. Resources: A list of all Equipment and their attributes Detail Panels: Information for the selected device and associated infrastructure Navigation Panel Main Panel This screen displays alarms received from discovered devices, the devices themselves, and details about devices you select in the lowest panel.
Scheduling Discovery When you first discover devices, you typically use a Discovery Profile that includes the discovery parameters (IP addresses, authentication used, and so on). You can keep your inventory up-to-date and discover equipment over a range of addresses by scheduling a repeated discovery.
Alternatively, open the Links manager, and click action -> Discover Links. In the next screens, Add the devices, or Add Groups of devices where you want to discover links with those buttons. Click Next and select the types of links to discover, and whether you want to confine links discovered to those between the selected devices, between selected and other discovered devices, or between the devices and the entire network. Click Next, and you can see the discovered links listed in an audit screen.
Interface Monitor This monitor collects bandwidth utilization and error counts for interfaces Figure 1:8. Default Interface Monitor The initial screen displays the SNMP attributes collected from the devices’ ifxTable. The default group of interfaces comes from the All Routers and Switches group. The Thresholds and Calculated Metrics screens display the specifics of how these collected attributes are monitored. This is an SNMP monitor.
ICMP Monitor The default ICMP Monitor reports on ping response times for all devices. Figure 1:9. Default ICMP Monitor The default sends three 64 byte packets every second to the All Devices group. Custom Monitor To set up a custom performance monitor, follow these steps: 1. Creating a Custom Monitor 2. Show Performance 3. Install a Monitor in the View Creating a Custom Monitor 1. Open the Active Monitoring -> Monitor manager, and create a new monitor with action -> New. 2.
4. Select the interfaces you want to monitor by clicking Add in the top right corner of the screen. A selection screen appears, when you do. You must typically select a device in the upper panel, then select at least one interface in the lower one. You can multi-select by left-clicking while holding down the Ctrl key. 5. In the Thresholds screen, examine existing thresholds by clicking on the listed threshold in the upper panel, then clicking Edit.
If you multi-select several devices, each component displays the top five metrics for each attribute. If you select only one top-level device, OpenManage Network Manager searches the device's interface and port children for performance attributes and these attributes appear with the top five children for each attribute. The data that appears is based on the monitors that are monitoring that device and where Retain Data is checked.
8. Notice that our simple example does not exploit all possibilities for these views. For example, you can have several components within a single view. In the example below, the same monitor appears in all four panels, displaying the monitoring for different attributes in different graph types You can also configure a variety of views to reflect different monitoring needs, and with OpenManage Network Manager’s multi-windowing capabilities, flip back and forth between the different views.
Figure 1:10. Monitor Reports You can modify these reports, but by default, they include the monitored attributes and/or devices. The reports appear pre-configured for the day, week, and the last 30 days. These intervals too are modifiable. Consult the User Guide or online help for more information about customizing reports. Managing Resources Open the Resources screen to display the discovered devices. (See Discovering Resources for instructions about discovery.
Figure 1:11. Resource View Title bar, Action, Layout buttons and display Filters Discovered Resources Detail Pane describes a selected resource Navigation Panel You can view all discovered resources from this screen. Selecting a resource in the upper panel lets you view details about that resource in the lower panel. Click the plus (+) in the upper right corner of the Details Panel to add or remove sub-panels there. If the details panel is blank, that means you have selected no resource above.
Alarm Severity & Count This panel displays the count of events by severity, and totals them on the right. Figure 1:12. Event Severity & Count This can either display All Events or Open Events. Change between these counts by clicking the Layout button. Select Change Filter and choose the All Events or Open Events items. Alarm Manager In the Default filter, only Open alarms appear on these screens.
The Action Button or right-click menu displays the following items (some installations conceal some of these): Open -> Entity—This opens an editor where you can configure the device from which this alarm came. See the User Guide, or online help. Open -> Alarm—Opens a screen describing all the details of the selected alarm. See Alarm Panels . Open -> Equipment—This opens an editor where you can configure the device from which this alarm came (an Entity, if different, is a subcomponent of the equipment).
Map—Opens a topology view displaying the equipment from which the selected alarm(s) came. See Mapping Equipment , the User Guide or online help for more about this. E-mail Alarm—E-mail the selected alarm. A subsequent screen lets you specify the addressee, header, and footer. Print—Prints the displayed Alarms to a pdf file. Figure 1:14. Printed Alarms (pdf) You can print or save this report from Acrobat. If you do not have the free Acrobat reader, download it from www.adobe.com.
2 Common Tasks Managing Layouts When you select a manager, or view in the Navigation Panel a view appears (like Figure 2-1). A configurable filter appears at the very top of these managers. Click Go once you have re-configured it if you want to filter what appears in the upper panel. Figure 2-1. Default Manager View The detail panels portion of the screen is also configurable. Nodes that appear in the navigation panel depend on the installed options.
Creating and Selecting Screen Layouts You can customize the layout of the Device view by adding, removing, or reordering the sub panels. Changes to this layout can be saved. In addition OpenManage Network Manager remembers the last layout used. So if you change the screen appearance, the screen layout that appears just before closing the client is the same one that appears when you restart the client. This applies even for different users when they share the same computer.
Figure 2-3. Customized Layout Once you configure a customized layout, it remains configured for you as a user no matter what client machine you log in on, as long as your client refers to the same application server. You can even add content with Select Content, the pick list next to Select Layout when you use a custom layout. You can delete sub-screens with the “X” in their upper right corner.
Minimizing sub-panels The borders of sub-panels display triangles that are minimize buttons for the individual panels. Clicking this button minimizes that sub-panel. The remaining sub-panels automatically resize to fill in the remaining space. Column Drag and Drop You can drag and drop columns to rearrange them. You can also add columns by clicking the plus button to the right of Layout in a panel.
Users and User Groups The application’s User Manager lets you associate information with users like passwords, group membership, and contact information. Select Settings -> Permissions -> User Manager to see the User Manager. Figure 2-4. User Manager NOTE: This application comes with system users like OWAdmin. These are normal and cannot be deleted. Click action -> New to create a new user, or action -> Open to edit a user you have selected from the list.
User Groups The User Group Manager lets you create user groups just as you create or edit users. The detail panels display the name, description and whether the group is protected. Open this manager from Settings -> Permissions -> User Group Manager. Initially, a Group is nothing more than a name and a description. Figure 2-5. User Group Manager Click New or select a group and click Open to modify a group. You cannot delete some groups; for example, you cannot delete Administrators.
Permissions This panel appears in editors for both groups and individual users. It lets you configure permissions (also known as “functional permissions”) for individual users which override those configured for groups. The permissions displayed in this screen are only those for the selected, individual user (or group). To see the combined group and user permissions, see the All Permissions panel in the User editor. Figure 2-6.
Action Default Behavior read When checked, this enables the Edit menu item on the action menu. write When checked, this enables the Save button within editors. delete When checked, this enables the Delete menu item on the action menu within managers. The functional permissions that use these actions appear in this screen. Select a permission, and in the Group editor, the description appears at the bottom of the screen. NOTE: Functional permissions are global and additive with other permissions.
Scheduling Operations You can schedule many of this software’s actions. Open the Schedules screen either from File -> Open -> System Services -> Schedules or from the navigation pane. Figure 2-7. Schedules Click New, then select an operation (Group Operations, Inventory Reports, Resynchronization, and so on), and configure the selected option. Finally, select the schedule timing, frequency, and so on. Consult the User Guide for more information about scheduling capabilities.
Create a group—Groups let you change settings on multiple devices. From Resources, select listed devices (Ctrl+click to select several), and right click. Select Add to Group, to add to an existing group, or New Group to create a new group with the selected devices. Selecting Group Op lets you do things to the entire group of devices. See the User Guide for details. Mapping Equipment In addition to their listing in the Inventory screen, discovered resources can appear in a topology mapping. Figure 2-8.
5 In the next screen, select the inventory that you want to map. You can Ctrl+Click to select multiple items. 6 Click Select. 7 The equipment appears, represented as icons on a blank (white) screen. You can re-arrange these icons by clicking and dragging them. The icons display the color of the highest value alarm (critical / red is the highest) that most recently came from that device. 8 Select a background by clicking Properties, then selecting a background from the pick list.
Common Tasks
3 Backup / Restore / Deploy File Management: Backup / Restore / Deploy Once you discover devices on your network, you can use OpenManage Network Manager’s Backup / Restore functionality to archive configuration files, and manage them. You can also Deploy OS updates and firmware to these devices using the Deploy capabilities. When you have the correct device drivers and configuration, you can backup and restore device configurations, and can deploy firmware updates to devices that support these functions.
• If you select two backed-up devices, you can select Compare to view a side-by-side comparison of the two devices’ configuration files with the differences highlighted. You can also select only a single device with more than one configuration backup and compare those, after selecting backup versions on a subsequent screen. Alternatively, you can double-click a device listed in Resources (or select Open from the context or Action button menu).
4 Troubleshooting Troubleshooting Tips The following answer common questions that arise when managing your equipment. For more details, refer to the User Guide. The applicability of the following will depend on what drivers and other add-ons you have installed with OpenManage Network Manager. The following sections discuss some troubleshooting techniques. See this software’s User Guide for more.
Equipment values are not configurable: • Ensure the login credentials are correct (consult your network administrator) Deploying firmware fails. Symptoms include pressing the Deploy Now button does nothing. You may also find that the FTP/TFTP File Server status is Stopped. • 48 A possible work-around is to perform a Backup of the device first.
Index A Active Performance Monitor Default ICMP Monitor, 24 Default Interface Monitor, 23 Alarm Manager, 30 Functional Permissions, 39 Monitor Reports, 28 Printed Alarms (pdf), 32 Resource View, 29 Schedule Info, 21 Schedules, 41 Active Performance Monitor, 22 Administering the Application, 36 Alarm Manager, 30 anti-virus software.
S Scheduling Operations, 41 Screen Layouts, 11 Setting Up FTP / TFTP, 45 Shared drive unsupported, 8 Starting the Client, 14 System Basics, 6 System requirements, 6 T Topology, 42 U Updating Your License, 9 Upgrade licenses from previous version, 9 User Group Manager, 38 User Groups Manager, 38 Users and User Groups, 37 W Windows Server 2008, 6 Windows Terminal Server, 6 50 Dell Quick Reference Guide