
Users Guide

Using Server Administrator 59
Data Area
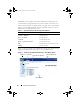
The data area is located below the action tabs on the right side of the home
page. The data area is where you perform tasks or view details about system
components. The content of the window depends on the system tree object
and action tab that are currently selected. For example, when you select BIOS
from the system tree, the Properties tab is selected by default and the version
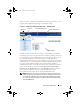
information for the system BIOS appears in the data area. The data area of
the action window contains many common features, including status
indicators, task buttons, underlined items, and gauge indicators.
System/Server Module Component Status Indicators
The icons that appear next to component names show the status of that
component (as of the latest page refresh).
Table 5-2. System/Server Module Component Status Indicators
A green check mark indicates that a component is healthy (normal).
A yellow triangle containing an exclamation point indicates that a
component has a warning (noncritical) condition. A warning condition
occurs when a probe or other monitoring tool detects a reading for a
component that falls within certain minimum and maximum values. A
warning condition requires prompt attention.
A red X indicates that a component has a failure (critical) condition. A
critical condition occurs when a probe or other monitoring tool detects a
reading for a component that falls within certain minimum and maximum
values. A critical condition requires immediate attention.
A blank space indicates that a component's health status is unknown.
book.book Page 59 Monday, July 7, 2008 2:59 PM