
Users Guide
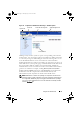
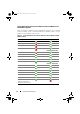
Table Of Contents
- Introduction
- Setup and Administration
- Security Management
- Assigning User Privileges
- Disabling Guest and Anonymous Accounts in Supported Windows Operating Systems
- Configuring the SNMP Agent
- Configuring the SNMP Agent for Systems Running Supported Windows Operating Systems
- Configuring the SNMP Agent on Systems Running Supported Red Hat Enterprise Linux
- Configuring the SNMP Agent on Systems Running Supported SUSE Linux Enterprise Server
- Configuring the SNMP Agent on Systems Running Supported VMware ESX 4.X Operating Systems to Proxy VMware MIBs
- Configuring the SNMP Agent on Systems Running Supported VMware ESXi 4.X Operating Systems
- Firewall Configuration on Systems Running Supported Red Hat Enterprise Linux Operating Systems and SUSE Linux Enterprise Server
- Using Server Administrator
- Server Administrator Services
- Working With Remote Access Controller
- Overview
- Viewing Basic Information
- Configuring the Remote Access Device to use a LAN Connection
- Configuring the Remote Access Device to use a Serial Port Connection
- Configuring the Remote Access Device to use a Serial Over LAN Connection
- Additional Configuration for iDRAC
- Configuring Remote Access Device Users
- Setting Platform Event Filter Alerts
- Server Administrator Logs
- Setting Alert Actions
- Setting Alert Actions for Systems Running Supported Red Hat Enterprise Linux and SUSE Linux Enterprise Server Operating Systems
- Setting Alert Actions in Microsoft Windows Server 2003 and Windows Server 2008
- Setting Alert Action Execute Application in Windows Server 2008
- BMC/iDRAC Platform Events Filter Alert Messages
- Understanding Service Names
- Troubleshooting
- Frequently Asked Questions
- Index
54 Using Server Administrator
Data Area
The data area is located below the action tabs on the right side of the home
page. The data area is where you perform tasks or view details about system
components. The content of the window depends on the system tree object
and action tab that are currently selected. For example, when you select BIOS
from the system tree, the Properties tab is selected by default and the version
information for the system BIOS appears in the data area. The data area of
the action window contains many common features, including status
indicators, task buttons, underlined items, and gauge indicators.
The Server Administrator user interface displays the date in the
<mm/dd/yyyy> format.
System/Server Module Component Status Indicators
The icons that appear next to component names show the status of that
component (as of the latest page refresh).
Task Buttons
Most windows opened from the Server Administrator home page contain at
least four task buttons: Print, Export, Email, and Refresh. Other task buttons
are included on specific Server Administrator windows. Log windows,
for example, also contain Save As and Clear Log task buttons. For specific
Table 3-3. System/Server Module Component Status Indicators
A green check mark indicates that a component is healthy (normal).
A yellow triangle containing an exclamation point indicates that a
component has a warning (noncritical) condition. A warning condition
occurs when a probe or other monitoring tool detects a reading for a
component that falls within certain minimum and maximum values.
A warning condition requires prompt attention.
A red X indicates that a component has a failure (critical) condition.
A critical condition occurs when a probe or other monitoring tool detects
a reading for a component that falls within certain minimum and maximum
values. A critical condition requires immediate attention.
A blank space indicates that a component's health status is unknown.
book.book Page 54 Tuesday, July 6, 2010 12:01 PM