
Specifications


3.2. ACCURACY
11
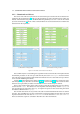
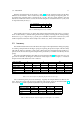
With the Acquisition Delay set to 10000[ns], table 3.1 shows the maximal sample rates for three
different sets of channels. This is without any controller, so only sending and acquiring data. As
an example, the procedure above is carried out for a set of 7 AIn and 7 AOut channels. Only the
desired set of channels is known, so first the maximal sample rate is determined to be 16[kHz] with
an Acquisition Delay of 3000[ns].
N
o
of channels 1 8 16
Sample rate [kHz] 22.5 15 9
Table 3.1: Maximal sample rate for sets of channels.
Next a sample rate of 10[kHz] is chosen. The minimal Acquisition Delay stays 3000[ns]. The max-
imum is about 40000[ns] without loosing the Real-Time property or having the PC not-responding.
This leaves 37[µs] in a loop of 100[µs] (10[kHz]) for a controller computation, so almost 40[%]! This
could be expected, because the chosen sample rate is about 60[%] of the maximal sample rate.
3.2 Accuracy
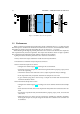
The Simulink model will execute with discrete time-steps. This implies that the Analog Out port(s)
are sending a sample while the Analog In port(s) are acquiring the previous sample. This time delay
will work the other way around in a real system. Where first some measurement signal will be ac-
quired, and in the next time-step that sample will be processed by a controller and send by the Out
port(s).
The errors which illustrate this time delay are summarized in table 3.2. The same sine wave was
put on all 16 channels. By taking the error between AOut sample k and AIn sample k
−1
instead of
sample k for the both of them, the error is reduced.
Sine wave [Hz] 4 4 50
N
o
of channels 16 16 1
Sample freq [kHz] 0.5 1.0 10.0
Sample shift - yes - yes - yes
1 [V] [-0.070, 0.050] [-0.025, 0.010] [-0.045, 0.030] [-0.025, 0.010] [-0.070, 0.035] [-0.040, 0.010]
2 [V] [-0.120, 0.100] [-0.035, 0.020] [-0.070, 0.055] [-0.035, 0.020] [-0.100, 0.065] [-0.050, 0.015]
5 [V] [-0.270, 0.250] [-0.100, 0.040] [-0.150, 0.135] [-0.100, 0.040] [-0.200, 0.160] [-0.080, 0.035]
Table 3.2: Error intervals [min, max] illustrating the phase shift due to time-steps.
Next a constant signal is put on the channel(s). Logically, the sample shift has no effect on the
error. The error increases with increasing amplitude of the signals, which can be found in table 3.2
too. In section 3.3 possible explanations/solutions are given for this problem.
N
o
of channels 1 16
Time-step [kHz] 10.0 1.0
Sample shift - yes - yes
2 [V] [-0.006, 0.010] [-0.006, 0.010] [-0.007, 0.020] [-0.007, 0.020]
5 [V] [0.017, 0.035] [0.017, 0.035] [0.015, 0.045] [0.015, 0.045]
Table 3.3: Error intervals [min, max] when applying a constant signal to sets of channels.