
White Papers
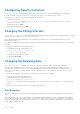
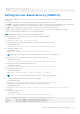
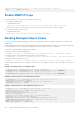
Table Of Contents
- Dell PowerEdge FN I/O Module Configuration Guide 9.14.1.5
- About this Guide
- Before You Start
- Configuration Fundamentals
- Getting Started
- Console Access
- Accessing the CLI Interface and Running Scripts Using SSH
- Boot Process
- Default Configuration
- Configuring a Host Name
- Configuring a Unique Host Name on the System
- Accessing the System Remotely
- Configuring the Enable Password
- Configuration File Management
- Managing the File System
- View the Command History
- Using HTTP for File Transfers
- Upgrading and Downgrading the Dell Networking OS
- Verify Software Images Before Installation
- Deploying FN I/O Module
- Management
- Configuring Privilege Levels
- Configuring Logging
- Display the Logging Buffer and the Logging Configuration
- Log Messages in the Internal Buffer
- Disabling System Logging
- Sending System Messages to a Syslog Server
- Changing System Logging Settings
- Display the Logging Buffer and the Logging Configuration
- Configuring a UNIX Logging Facility Level
- Synchronizing Log Messages
- Enabling Timestamp on Syslog Messages
- Enabling Secure Management Mode
- Enabling Secured CLI Mode
- File Transfer Services
- Terminal Lines
- Setting Time Out of EXEC Privilege Mode
- Using Telnet to get to Another Network Device
- Lock CONFIGURATION Mode
- Limit Concurrent Login Sessions
- Track Login Activity
- Recovering from a Forgotten Password
- Recovering from a Forgotten Enable Password
- Recovering from a Failed Start
- 802.1X
- Access Control List (ACL) VLAN Groups and Content Addressable Memory (CAM)
- Access Control Lists (ACLs)
- IP Access Control Lists (ACLs)
- Implementing ACL on the Dell Networking OS
- ACLs and VLANs
- ACL Optimization
- Determine the Order in which ACLs are Used to Classify Traffic
- IP Fragment Handling
- IP Fragments ACL Examples
- Layer 4 ACL Rules Examples
- Configure a Standard IP ACL
- Configuring a Standard IP ACL Filter
- Configure an Extended IP ACL
- Configuring Filters with a Sequence Number
- Configuring Filters Without a Sequence Number
- Established Flag
- Configure Layer 2 and Layer 3 ACLs
- Assign an IP ACL to an Interface
- Applying an IP ACL
- Counting ACL Hits
- Configure Ingress ACLs
- Configure Egress ACLs
- Applying Egress Layer 3 ACLs (Control-Plane)
- IP Prefix Lists
- Configuration Task List for Prefix Lists
- Creating a Prefix List
- Creating a Prefix List Without a Sequence Number
- Viewing Prefix Lists
- Applying a Prefix List for Route Redistribution
- Applying a Filter to a Prefix List (OSPF)
- ACL Remarks
- ACL Resequencing
- Resequencing an ACL or Prefix List
- Route Maps
- Important Points to Remember
- Configuration Task List for Route Maps
- Creating a Route Map
- Configure Route Map Filters
- Configuring Match Routes
- Configuring Set Conditions
- Configure a Route Map for Route Redistribution
- Configure a Route Map for Route Tagging
- Continue Clause
- Logging of ACL Processes
- Guidelines for Configuring ACL Logging
- Configuring ACL Logging
- Flow-Based Monitoring Support for ACLs
- Enabling Flow-Based Monitoring
- Bidirectional Forwarding Detection (BFD)
- Border Gateway Protocol IPv4 (BGPv4)
- Autonomous Systems (AS)
- Sessions and Peers
- Route Reflectors
- BGP Attributes
- Multiprotocol BGP
- Implement BGP with the Dell Networking OS
- Configuration Information
- BGP Configuration
- Enabling BGP
- Configuring AS4 Number Representations
- Configuring Peer Groups
- Configuring BGP Fast Fail-Over
- Configuring Passive Peering
- Maintaining Existing AS Numbers During an AS Migration
- Allowing an AS Number to Appear in its Own AS Path
- Enabling Graceful Restart
- Filtering on an AS-Path Attribute
- Regular Expressions as Filters
- Redistributing Routes
- Enabling Additional Paths
- Configuring IP Community Lists
- Configuring an IP Extended Community List
- Filtering Routes with Community Lists
- Manipulating the COMMUNITY Attribute
- Changing MED Attributes
- Changing the LOCAL_PREFERENCE Attribute
- Changing the NEXT_HOP Attribute
- Changing the WEIGHT Attribute
- Enabling Multipath
- Filtering BGP Routes
- Configuring BGP Route Reflectors
- Aggregating Routes
- Configuring BGP Confederations
- Enabling Route Flap Dampening
- Changing BGP Timers
- Setting the extended timer
- Enabling BGP Neighbor Soft-Reconfiguration
- Enabling or disabling BGP neighbors
- Route Map Continue
- Enabling MBGP Configurations
- Enabling BGP
- BGP Regular Expression Optimization
- Debugging BGP
- Sample Configurations
- Configuration Cloning
- Content Addressable Memory (CAM)
- Control Plane Policing (CoPP)
- Data Center Bridging (DCB)
- Ethernet Enhancements in Data Center Bridging
- Priority-Based Flow Control
- Enhanced Transmission Selection
- Data Center Bridging Exchange Protocol (DCBx)
- Creating a DCB Map
- Data Center Bridging: Default Configuration
- Data Center Bridging in a Traffic Flow
- Data Center Bridging: Auto-DCB-Enable Mode
- Configuring Priority-Based Flow Control
- Configuring Enhanced Transmission Selection
- Hierarchical Scheduling in ETS Output Policies
- DCBx Operation
- Verifying the DCB Configuration
- QoS dot1p Traffic Classification and Queue Assignment
- Troubleshooting PFC, ETS, and DCBx Operation
- Dynamic Host Configuration Protocol (DHCP)
- Assigning an IP Address using DHCP
- Debugging DHCP Client Operation
- DHCP Client
- How DHCP Client is Implemented
- DHCP Client on a Management Interface
- DHCP Client on a VLAN
- DHCP Packet Format and Options
- Option 82
- DHCPv6 relay agent options
- Releasing and Renewing DHCP-based IP Addresses
- Viewing DHCP Statistics and Lease Information
- Configuring DHCP relay source interface
- DHCP Snooping
- Enabling DHCP Snooping
- Enabling IPv6 DHCP Snooping
- Adding a Static Entry in the Binding Table
- Adding a Static IPV6 DHCP Snooping Binding Table
- Clearing the Binding Table
- Clearing the DHCP IPv6 Binding Table
- Displaying the Contents of the Binding Table
- Displaying the Contents of the DHCPv6 Binding Table
- Debugging the IPv6 DHCP
- IPv6 DHCP Snooping MAC-Address Verification
- Equal Cost Multi-Path (ECMP)
- FC FPORT
- FCoE Transit
- Fibre Channel over Ethernet
- Ensure Robustness in a Converged Ethernet Network
- FIP Snooping on Ethernet Bridges
- FIP Snooping in a Switch Stack
- Using FIP Snooping
- Important Points to Remember
- Enabling the FCoE Transit Feature
- Enable FIP Snooping on VLANs
- Configure the FC-MAP Value
- Configure a Port for a Bridge-to-Bridge Link
- Configure a Port for a Bridge-to-FCF Link
- Impact on Other Software Features
- FIP Snooping Prerequisites
- FIP Snooping Restrictions
- Configuring FIP Snooping
- Displaying FIP Snooping Information
- FCoE Transit Configuration Example
- FIPS Cryptography
- Force10 Resilient Ring Protocol (FRRP)
- GARP VLAN Registration Protocol (GVRP)
- FIP Snooping
- Internet Group Management Protocol (IGMP)
- Interfaces
- Interface Types
- View Basic Interface Information
- Configuring the Default Interface
- Enabling a Physical Interface
- Physical Interfaces
- Automatic recovery of an Err-disabled interface
- Management Interfaces
- VLAN Interfaces
- Loopback Interfaces
- Null Interfaces
- VLAN Membership
- Port Channel Interfaces
- Port Channel Definition and Standards
- Port Channel Benefits
- Port Channel Implementation
- 100/1000/10000 Mbps Interfaces in Port Channels
- Configuration Tasks for Port Channel Interfaces
- Creating a Port Channel
- Adding a Physical Interface to a Port Channel
- Reassigning an Interface to a New Port Channel
- Configuring the Minimum Oper Up Links in a Port Channel
- Adding or Removing a Port Channel from a VLAN
- Assigning an IP Address to a Port Channel
- Deleting or Disabling a Port Channel
- Load Balancing through Port Channels
- Changing the Hash Algorithm
- Server Ports
- Bulk Configuration
- Defining Interface Range Macros
- Monitoring and Maintaining Interfaces
- Splitting QSFP Ports to SFP+ Ports
- Configuring wavelength for 10–Gigabit SFP+ optics
- Converting a QSFP or QSFP+ Port to an SFP or SFP+ Port
- Layer 2 Flow Control Using Ethernet Pause Frames
- Configure MTU Size on an Interface
- Port-Pipes
- Auto-Negotiation on Ethernet Interfaces
- View Advanced Interface Information
- Enhanced Control of Remote Fault Indication Processing
- Internet Protocol Security (IPSec)
- IPv4 Routing
- IP Addresses
- IPv4 Path MTU Discovery Overview
- Using the Configured Source IP Address in ICMP Messages
- Configuring the Duration to Establish a TCP Connection
- Enabling Directed Broadcast
- Resolution of Host Names
- ARP
- ARP Learning via Gratuitous ARP
- ARP Learning via ARP Request
- Configuring ARP Retries
- ICMP
- ICMP Redirects
- UDP Helper
- Configurations Using UDP Helper
- Troubleshooting UDP Helper
- IPv6 Routing
- Protocol Overview
- IPv6 Header Fields
- Extension Header Fields
- Addressing
- Implementing IPv6 with the Dell Networking OS
- ICMPv6
- Path MTU Discovery
- IPv6 Neighbor Discovery
- Configuration Task List for IPv6 RDNSS
- IPv6 Multicast
- Configuration Task List for IPv6
- Adjusting Your CAM-Profile
- Assigning an IPv6 Address to an Interface
- Assigning a Static IPv6 Route
- Configuring Telnet with IPv6
- SNMP over IPv6
- Showing IPv6 Information
- Showing an IPv6 Interface
- Showing IPv6 Routes
- Showing the Running-Configuration for an Interface
- Clearing IPv6 Routes
- Disabling ND Entry Timeout
- Secure Shell (SSH) Over an IPv6 Transport
- iSCSI Optimization
- Intermediate System to Intermediate System
- IS-IS Protocol Overview
- IS-IS Addressing
- Multi-Topology IS-IS
- Graceful Restart
- Implementation Information
- Configuration Information
- Configuration Tasks for IS-IS
- Enabling IS-IS
- Configuring Multi-Topology IS-IS (MT IS-IS)
- Configuring IS-IS Graceful Restart
- Changing LSP Attributes
- Configuring the IS-IS Metric Style
- Configuring the IS-IS Cost
- Configuring the Distance of a Route
- Changing the IS-Type
- Controlling Routing Updates
- Distribute Routes
- Configuring Authentication Passwords
- Setting the Overload Bit
- Debugging IS-IS
- Configuration Tasks for IS-IS
- IS-IS Metric Styles
- Configure Metric Values
- Sample Configurations
- Isolated Networks for Aggregators
- Link Aggregation
- How the LACP is Implemented on an Aggregator
- Link Aggregation Control Protocol (LACP)
- Configuring Auto LAG
- Configuring the Minimum Number of Links to be Up for Uplink LAGs to be Active
- Optimizing Traffic Disruption Over LAG Interfaces On IOA Switches in VLT Mode
- Preserving LAG and Port Channel Settings in Nonvolatile Storage
- Enabling LACP link-fallback
- Enabling the Verification of Member Links Utilization in a LAG Bundle
- Monitoring the Member Links of a LAG Bundle
- Verifying LACP Operation and LAG Configuration
- Multiple Uplink LAGs with 10G Member Ports
- Layer 2
- Link Layer Discovery Protocol (LLDP)
- Protocol Data Units
- Configure LLDP
- CONFIGURATION versus INTERFACE Configurations
- Enabling LLDP
- Advertising TLVs
- Optional TLVs
- LLDP Operation
- Storing and Viewing Unrecognized LLDP TLVs
- Viewing the LLDP Configuration
- Viewing Information Advertised by Adjacent LLDP Agents
- Configuring LLDPDU Intervals
- Configuring a Time to Live
- Clearing LLDP Counters
- Debugging LLDP
- Relevant Management Objects
- Microsoft Network Load Balancing
- Multicast Source Discovery Protocol (MSDP)
- Anycast RP
- Implementation Information
- Configure the Multicast Source Discovery Protocol
- Enabling MSDP
- Manage the Source-Active Cache
- Accept Source-Active Messages that Fail the RFP Check
- Specifying Source-Active Messages
- Limiting the Source-Active Messages from a Peer
- Preventing MSDP from Caching a Local Source
- Preventing MSDP from Caching a Remote Source
- Preventing MSDP from Advertising a Local Source
- Logging Changes in Peership States
- Terminating a Peership
- Clearing Peer Statistics
- Debugging MSDP
- MSDP with Anycast RP
- Configuring Anycast RP
- MSDP Sample Configurations
- Multiple Spanning Tree Protocol (MSTP)
- Spanning Tree Variations
- Implementation Information
- Configure Multiple Spanning Tree Protocol
- Enable Multiple Spanning Tree Globally
- Creating Multiple Spanning Tree Instances
- Influencing MSTP Root Selection
- Interoperate with Non-Dell Networking OS Bridges
- Changing the Region Name or Revision
- Modifying Global Parameters
- Enable BPDU Filtering Globally
- Modifying the Interface Parameters
- Configuring an EdgePort
- Flush MAC Addresses after a Topology Change
- MSTP Sample Configurations
- Debugging and Verifying MSTP Configurations
- Multicast Features
- Open Shortest Path First (OSPFv2 and OSPFv3)
- Protocol Overview
- OSPF with the Dell Networking OS
- Configuration Information
- Configuration Task List for OSPFv2 (OSPF for IPv4)
- Enabling OSPFv2
- Assigning a Router ID
- Assigning an OSPFv2 Area
- Enable OSPFv2 on Interfaces
- Configuring Stub Areas
- Configuring LSA Throttling Timers
- Enabling Passive Interfaces
- Enabling Fast-Convergence
- Changing OSPFv2 Parameters on Interfaces
- Enabling OSPFv2 Authentication
- Enabling OSPFv2 Graceful Restart
- Creating Filter Routes
- Applying Prefix Lists
- Redistributing Routes
- Troubleshooting OSPFv2
- Configuration Task List for OSPFv2 (OSPF for IPv4)
- OSPFv3 NSSA
- Configuration Task List for OSPFv3 (OSPF for IPv6)
- Enabling IPv6 Unicast Routing
- Assigning IPv6 Addresses on an Interface
- Assigning Area ID on an Interface
- Assigning OSPFv3 Process ID and Router ID Globally
- Configuring Stub Areas
- Configuring Passive-Interface
- Redistributing Routes
- Configuring a Default Route
- Enabling OSPFv3 Graceful Restart
- Displaying Graceful Restart
- OSPFv3 Authentication Using IPsec
- OSPFv3 Authentication Using IPsec: Configuration Notes
- Configuring IPsec Authentication on an Interface
- Configuring IPsec Encryption on an Interface
- Configuring IPSec Authentication for an OSPFv3 Area
- Configuring IPsec Encryption for an OSPFv3 Area
- Displaying OSPFv3 IPsec Security Policies
- Troubleshooting OSPFv3
- Viewing Summary Information
- MIB Support for OSPFv3
- MIB Support for OSPFv3
- Policy-based Routing (PBR)
- PIM Sparse-Mode (PIM-SM)
- PIM Source-Specific Mode (PIM-SSM)
- Port Monitoring
- Private VLANs (PVLAN)
- Per-VLAN Spanning Tree Plus (PVST+)
- Quality of Service (QoS)
- Implementation Information
- Port-Based QoS Configurations
- Guidelines for Configuring ECN for Classifying and Color-Marking Packets
- Policy-Based QoS Configurations
- DSCP Color Maps
- Classify Traffic
- Create a QoS Policy
- Creating an Input QoS Policy
- Configuring Policy-Based Rate Policing
- Setting a DSCP Value for Egress Packets
- Setting a dot1p Value for Egress Packets
- Creating an Output QoS Policy
- Configuring Policy-Based Rate Shaping
- Allocating Bandwidth to Queue
- Configure a Scheduler to Queue
- Setting DSCP Values for Egress Packets Based on Flow
- Specifying WRED Drop Precedence
- Create Policy Maps
- Creating Input Policy Maps
- Applying a Class-Map or Input QoS Policy to a Queue
- Applying an Input QoS Policy to an Input Policy Map
- Honoring DSCP Values on Ingress Packets
- Honoring dot1p Values on Ingress Packets
- Enabling Fall Back to Trust Diffserve or dot1p
- Mapping dot1p Values to Service Queues
- Guaranteeing Bandwidth to dot1p-Based Service Queues
- Applying an Input Policy Map to an Interface
- Creating Output Policy Maps
- Applying an Output QoS Policy to a Queue
- Specifying an Aggregate QoS Policy
- Applying an Output Policy Map to an Interface
- Enabling QoS Rate Adjustment
- Enabling Strict-Priority Queueing
- Weighted Random Early Detection
- Routing Information Protocol (RIP)
- Remote Monitoring (RMON)
- Rapid Spanning Tree Protocol (RSTP)
- Protocol Overview
- Configuring Rapid Spanning Tree
- Configuring Interfaces for Layer 2 Mode
- Enabling Rapid Spanning Tree Protocol Globally
- Adding and Removing Interfaces
- Modifying Global Parameters
- Enable BPDU Filtering Globally
- Modifying Interface Parameters
- Configuring an EdgePort
- Influencing RSTP Root Selection
- SNMP Traps for Root Elections and Topology Changes
- Configuring Fast Hellos for Link State Detection
- Security
- Understanding Banner Settings
- Accessing the I/O Aggregator Using the CMC Console Only
- AAA Accounting
- AAA Authentication
- AAA Authorization
- RADIUS
- RADIUS Authentication and Authorization
- Configuration Task List for RADIUS
- Support for Change of Authorization and Disconnect Messages packets
- Change of Authorization (CoA) packets
- Disconnect Messages
- Attributes
- Error-cause Values
- CoA Packet Processing
- CoA or DM Discard
- Disconnect Message Processing
- Configuring DAC
- Configuring the port number
- Configuring shared key
- Disconnecting administrative users logged in through RADIUS
- Configuring CoA to bounce 802.1x enabled ports
- Configuring CoA to re-authenticate 802.1x sessions
- Terminating the 802.1x user session
- Disabling 802.1x enabled port
- Important points to remember
- Configuring replay protection
- Rate-limiting RADIUS packets
- Configuring time-out value
- TACACS+
- Enabling SCP and SSH
- Telnet
- VTY Line and Access-Class Configuration
- Role-Based Access Control
- Dell EMC Networking OS Security Hardening
- Service Provider Bridging
- sFlow
- Simple Network Management Protocol (SNMP)
- Implementation Information
- Configuring the Simple Network Management Protocol
- Setting Up User-Based Security (SNMPv3)
- Enable SNMPv3 traps
- Reading Managed Object Values
- Displaying the Ports in a VLAN using SNMP
- Fetching Dynamic MAC Entries using SNMP
- Deriving Interface Indices
- Monitor Port-Channels
- Entity MIBS
- SNMP Traps for Link Status
- Standard VLAN MIB
- MIB Support to Display the Available Memory Size on Flash
- MIB Support to Display the Software Core Files Generated by the System
- SNMP Support for WRED Green/Yellow/Red Drop Counters
- MIB Support to Display the Available Partitions on Flash
- MIB Support to Display Egress Queue Statistics
- MIB Support to Display Egress Queue Statistics
- MIB Support for entAliasMappingTable
- MIB Support for LAG
- MIB Support to Display Unrecognized LLDP TLVs
- MIB support for Port Security
- Transceiver Monitoring
- Configuring SNMP context name
- Stacking
- Storm Control
- Broadcast Storm Control
- Spanning Tree Protocol (STP)
- Protocol Overview
- Configure Spanning Tree
- Configuring Interfaces for Layer 2 Mode
- Enabling Spanning Tree Protocol Globally
- Adding an Interface to the Spanning Tree Group
- Removing an Interface from the Spanning Tree Group
- Modifying Global Parameters
- Modifying Interface STP Parameters
- Enabling Port Fast
- Global BPDU Filtering
- Selecting STP Root
- STP Root Guard
- SNMP Traps for Root Elections and Topology Changes
- Displaying STP Guard Configuration
- SupportAssist
- System Time and Date
- Tunneling
- Uplink Failure Detection (UFD)
- Feature Description
- How Uplink Failure Detection Works
- UFD and NIC Teaming
- Important Points to Remember
- Uplink Failure Detection (SMUX mode)
- Configuring Uplink Failure Detection (PMUX mode)
- Clearing a UFD-Disabled Interface (in PMUX mode)
- Displaying Uplink Failure Detection
- Sample Configuration: Uplink Failure Detection
- PMUX Mode of the IO Aggregator
- I/O Aggregator (IOA) Programmable MUX (PMUX) Mode
- Configuring and Changing to PMUX Mode
- Configuring the Commands without a Separate User Account
- Virtual Link Trunking (VLT)
- NPIV Proxy Gateway
- Upgrade Procedures
- Virtual LANs (VLANs)
- Virtual Link Trunking (VLT)
- Overview
- VLT Terminology
- Configure Virtual Link Trunking
- RSTP Configuration
- Preventing Forwarding Loops in a VLT Domain
- Sample RSTP Configuration
- Configuring VLT
- Configuring a VLT Interconnect
- Configuring a VLT Backup Link
- Configuring a VLT Port Delay Period
- Reconfiguring the Default VLT Settings (Optional)
- Connecting a VLT Domain to an Attached Access Device (Switch or Server)
- Configuring a VLT VLAN Peer-Down (Optional)
- Configure Multi-domain VLT (mVLT) (Optional)
- Verifying a VLT Configuration
- Connecting a VLT Domain
- PVST+ Configuration
- mVLT Configuration Example
- PIM-Sparse Mode Configuration Example
- Additional VLT Sample Configurations
- Troubleshooting VLT
- Specifying VLT Nodes in a PVLAN
- Configuring a VLT VLAN or LAG in a PVLAN
- Proxy ARP Capability on VLT Peer Nodes
- Configuring VLAN-Stack over VLT
- Configure BFD in VLT Domain
- Virtual Router Redundancy Protocol (VRRP)
- VRRP Overview
- VRRP Benefits
- VRRP Implementation
- VRRP Configuration
- Configuration Task List
- Setting VRRP Initialization Delay
- Sample Configurations
- Debugging and Diagnostics
- Standards Compliance
- FC Flex IO Modules
- FC Flex IO Modules
- Understanding and Working of the FC Flex IO Modules
- Data Center Bridging (DCB)
- Ethernet Enhancements in Data Center Bridging
- Enabling Data Center Bridging
- QoS dot1p Traffic Classification and Queue Assignment
- Configure Enhanced Transmission Selection
- Configure a DCBx Operation
- Verifying the DCB Configuration
- PFC and ETS Configuration Examples
- Using PFC and ETS to Manage Data Center Traffic
- Fibre Channel over Ethernet for FC Flex IO Modules
- NPIV Proxy Gateway for FC Flex IO Modules

● Displaying Show sFlow on a Stack Unit
Displaying Show sFlow Global
To view sFlow statistics, use the following command.
● Display sFlow configuration information and statistics.
EXEC mode
show sflow
The first bold line indicates sFlow is globally enabled.
Dell#show sflow
sFlow services are enabled
Global default sampling rate: 32768
Global default counter polling interval: 20
1 collectors configured
Collector IP addr: 133.33.33.53, Agent IP addr: 133.33.33.116, UDP port: 6343
77 UDP packets exported
0 UDP packets dropped
165 sFlow samples collected
69 sFlow samples dropped due to sub-sampling
Dell#
Displaying Show sFlow on an Interface
To view sFlow information on a specific interface, use the following command.
● Display sFlow configuration information and statistics on a specific interface.
EXEC mode
show sflow interface interface-name
Dell#show sflow interface tengigabitethernet 1/16
Te 1/16
Configured sampling rate :8192
Actual sampling rate :8192
Sub-sampling rate :2
Counter polling interval :15
Samples rcvd from h/w :33
Samples dropped for sub-sampling :6
Displaying Show sFlow on a Stack Unit
To view sFlow statistics on a specified stack unit, use the following command.
●
Display sFlow configuration information and statistics on the specified interface.
EXEC mode
show sflow stack-unit unit-number
Dell#show sflow stack-unit 1
Stack-Unit 1
Samples rcvd from h/w :0
Total UDP packets exported :0
UDP packets exported via RPM :0
UDP packets dropped :0
Dell#
sFlow
723