
Users Guide
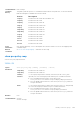
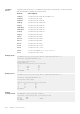
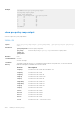
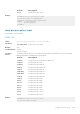
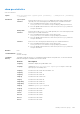
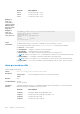
Table Of Contents
- Dell Command Line Reference Guide for the S4048–ON System 9.14.2.5
- About this Guide
- CLI Basics
- File Management
- Control and Monitoring
- asf-mode
- banner exec
- banner login
- banner motd
- cam-acl
- cam-acl-vlan
- clear average-power
- clear line
- configure
- disable
- do
- enable
- enable cpu-clock-monitor
- enable optic-info-update interval
- enable xfp-power-updates
- end
- exec-timeout
- exit
- ftp-server enable
- ftp-server topdir
- ftp-server username
- hostname
- ip http source-interface
- ip http vrf
- ip ftp password
- ip ftp source-interface
- ip ftp username
- ip ftp vrf
- ip telnet server enable
- ip telnet server vrf
- ip telnet source-interface
- ip telnet vrf
- ip tftp source-interface
- ip tftp vrf
- line
- login concurrent-session
- login statistics
- motd-banner
- ping
- reload
- send
- service timestamps
- show alarms
- show cam-acl-vlan
- show command-history
- show cpu-traffic-stats
- show debugging
- show environment
- show inventory
- show login statistics
- show memory
- show processes cpu
- show processes ipc flow-control
- show processes memory
- show reset-reason
- show software ifm
- show system
- show tech-support
- ssh-peer-stack-unit
- telnet
- telnet-peer-stack-unit
- terminal length
- traceroute
- undebug all
- virtual-ip
- write
- 802.1X
- debug dot1x
- dot1x auth-fail-vlan
- dot1x auth-server
- dot1x auth-type mab-only
- dot1x authentication (Configuration)
- dot1x authentication (Interface)
- dot1x critical-vlan
- dot1x guest-vlan
- dot1x host-mode
- dot1x mac-auth-bypass
- dot1x max-eap-req
- dot1x max-supplicants
- dot1x port-control
- dot1x profile
- dot1x quiet-period
- dot1x reauthentication
- dot1x reauth-max
- dot1x server-timeout
- dot1x static-mab
- dot1x supplicant-timeout
- dot1x tx-period
- mac
- show dot1x cos-mapping interface
- show dot1x interface
- show dot1x profile
- Access Control Lists (ACL)
- Commands Common to all ACL Types
- Common IP ACL Commands
- Standard IP ACL Commands
- Extended IP ACL Commands
- Common MAC Access List Commands
- Standard MAC ACL Commands
- Extended MAC ACL Commands
- IP Prefix List Commands
- Route Map Commands
- continue
- description
- match as-path
- match community
- match interface
- match ip address
- match ip next-hop
- match ip route-source
- match metric
- match origin
- match route-type
- match tag
- route-map
- set as-path
- set automatic-tag
- set comm-list delete
- set community
- set level
- set local-preference
- set metric
- set metric-type
- set next-hop
- set origin
- set tag
- set weight
- show config
- show route-map
- AS-Path Commands
- IP Community List Commands
- UDF ACL Commands
- deny (for Standard IP ACLs)
- deny (for Extended IP ACLs)
- seq (for Standard IPv4 ACLs)
- deny tcp (for Extended IP ACLs)
- deny udp (for Extended IP ACLs)
- deny arp (for Extended MAC ACLs)
- deny icmp (for Extended IP ACLs)
- deny ether-type (for Extended MAC ACLs)
- deny (for Standard MAC ACLs)
- deny (for Extended MAC ACLs)
- permit (for Standard IP ACLs)
- permit arp (for Extended MAC ACLs)
- permit ether-type (for Extended MAC ACLs)
- permit icmp (for Extended IP ACLs)
- permit udp (for Extended IP ACLs)
- permit (for Extended IP ACLs)
- permit (for Standard MAC ACLs)
- seq (for Standard MAC ACLs)
- permit tcp (for Extended IP ACLs)
- seq arp (for Extended MAC ACLs)
- seq ether-type (for Extended MAC ACLs)
- seq (for IP ACLs)
- seq (for IPv6 ACLs)
- permit udp (for IPv6 ACLs)
- permit tcp (for IPv6 ACLs)
- permit icmp (for IPv6 ACLs)
- permit (for IPv6 ACLs)
- deny udp (for IPv6 ACLs)
- deny tcp (for IPv6 ACLs)
- deny icmp (for Extended IPv6 ACLs)
- deny (for IPv6 ACLs)
- Access Control List (ACL) VLAN Groups and Content Addressable Memory (CAM)
- Bidirectional Forwarding Detection (BFD)
- Border Gateway Protocol
- BGP IPv4 Commands
- address-family
- aggregate-address
- bgp add-path
- bgp always-compare-med
- bgp asnotation
- bgp bestpath as-path ignore
- bgp bestpath as-path multipath-relax
- bgp bestpath med confed
- bgp bestpath med missing-as-best
- bgp bestpath router-id ignore
- bgp client-to-client reflection
- bgp cluster-id
- bgp confederation identifier
- bgp confederation peers
- bgp connection-retry-timer
- bgp dampening
- bgp default local-preference
- bgp dmzlink-bw
- bgp enforce-first-as
- bgp fast-external-fallover
- bgp four-octet-as-support
- bgp graceful-restart
- bgp non-deterministic-med
- bgp outbound-optimization
- bgp recursive-bgp-next-hop
- bgp redistribute-internal
- bgp regex-eval-optz-disable
- bgp router-id
- clear ip bgp
- clear ip bgp dampening
- clear ip bgp flap-statistics
- clear ip bgp peer-group
- deny bandwidth
- debug ip bgp
- debug ip bgp dampening
- debug ip bgp events
- debug ip bgp keepalives
- debug ip bgp notifications
- debug ip bgp soft-reconfiguration
- debug ip bgp updates
- default-metric
- description
- maximum-paths
- neighbor activate
- neighbor add-path
- neighbor advertisement-interval
- neighbor advertisement-start
- neighbor allowas-in
- neighbor default-originate
- neighbor description
- neighbor distribute-list
- neighbor ebgp-multihop
- neighbor fall-over
- neighbor local-as
- neighbor maximum-prefix
- neighbor next-hop-self
- neighbor password
- neighbor peer-group (assigning peers)
- neighbor peer-group (creating group)
- neighbor peer-group passive
- neighbor remote-as
- neighbor remove-private-as
- neighbor route-map
- neighbor route-reflector-client
- neighbor send-community
- neighbor sender-side-loopdetect
- neighbor shutdown
- neighbor soft-reconfiguration inbound
- neighbor timers
- neighbor timers extended
- neighbor update-source
- neighbor weight
- network
- network backdoor
- permit bandwidth
- redistribute
- redistribute ospf
- router bgp
- shutdown all
- shutdown address-family-ipv4–multicast
- shutdown address-family-ipv4–unicast
- shutdown address-family-ipv6–unicast
- set extcommunity bandwidth
- show capture bgp-pdu neighbor
- show config
- show ip bgp
- show ip bgp cluster-list
- show ip bgp community
- show ip bgp community-list
- show ip bgp dampened-paths
- show ip bgp detail
- show ip bgp extcommunity-list
- show ip bgp filter-list
- show ip bgp flap-statistics
- show ip bgp inconsistent-as
- show ip bgp neighbors
- show ip bgp next-hop
- show ip bgp paths
- show ip bgp paths community
- show ip bgp peer-group
- show ip bgp regexp
- show ip bgp summary
- show running-config bgp
- timers bgp
- timers bgp extended
- MBGP Commands
- BGP Extended Communities (RFC 4360)
- IPv6 BGP Commands
- IPv6 MBGP Commands
- BGP IPv4 Commands
- Content Addressable Memory (CAM)
- Control Plane Policing (CoPP)
- Data Center Bridging (DCB)
- DCB Command
- PFC Commands
- ETS Commands
- DCBX Commands
- dcb-map
- priority-pgid
- pfc mode on
- priority-group bandwidth pfc
- dcb-map stack-unit all stack-ports all
- show qos dcb-map
- dcb pfc-shared-buffer-size
- dcb-buffer-threshold
- priority
- qos-policy-buffer
- dcb-policy buffer-threshold (Interface Configuration)
- dcb-policy buffer-threshold (Global Configuration)
- show qos dcb-buffer-threshold
- dcb pfc-total-buffer-size
- show running-config dcb-buffer-threshold
- service-class buffer shared-threshold-weight
- dcb pfc-queues
- dcb {ets | pfc} enable
- Debugging and Diagnostics
- Diagnostics and Monitoring Commands
- Offline Diagnostic Commands
- Hardware Commands
- clear hardware stack-unit
- clear hardware system-flow
- clear hardware vlan-counters
- hardware watchdog
- show hardware mac
- show hardware ip
- show hardware stack-unit
- show hardware system-flow
- show hardware vlan-counters
- show hardware counters interface
- show hardware drops
- show hardware stack-unit buffer-stats-snapshot (Total Buffer Information)
- show hardware buffer interface
- show hardware buffer-stats-snapshot
- Dynamic Host Configuration Protocol (DHCP)
- Commands to Configure the System to be a DHCP Server
- Commands to Configure Secure DHCP
- arp inspection
- arp inspection-limit
- arp inspection-trust
- clear ip dhcp snooping
- clear ipv6 dhcp snooping binding
- ip dhcp relay
- ip dhcp snooping
- ipv6 dhcp snooping
- ipv6 dhcp snooping vlan
- ip dhcp snooping binding
- IPv6 DHCP Snooping Binding
- ip dhcp snooping database
- ipv6 dhcp snooping database write-delay
- ip dhcp snooping database renew
- ipv6 dhcp snooping database renew
- ip dhcp snooping trust
- ipv6 dhcp snooping trust
- ip dhcp source-address-validation
- ip dhcp relay information-option
- ip dhcp relay source-interface
- ipv6 dhcp relay source-interface
- ip dhcp snooping verify mac-address
- ipv6 dhcp snooping verify mac-address
- ip helper-address
- ipv6 helper-address
- show ip dhcp snooping
- show ipv6 dhcp snooping
- Commands to Configure DNS
- Equal Cost Multi-Path (ECMP)
- FIPS Cryptography
- FIP Snooping
- clear fip-snooping database interface vlan
- clear fip-snooping statistics
- debug fip snooping
- debug fip snooping rx
- feature fip-snooping
- fip-snooping enable
- fip-snooping fc-map
- fip-snooping max-sessions-per-enodemac
- fip-snooping port-mode fcf
- fip-snooping port-mode fcoe-trusted
- show fip-snooping config
- show fip-snooping enode
- show fip-snooping fcf
- show fip-snooping statistics
- show fip-snooping system
- show fip-snooping vlan
- show fips status
- Force10 Resilient Ring Protocol (FRRP)
- GARP VLAN Registration (GVRP)
- High Availability (HA)
- ICMP Message Types
- Internet Group Management Protocol (IGMP)
- Interfaces
- Basic Interface Commands
- clear counters
- clear dampening
- dampening
- default interface
- description
- duplex (10/100 Interfaces)
- disable stack-unit phy temp polling
- enable stack-unit phy temp polling
- enable stack-unit transceiver
- encapsulation dot1q
- errdisable recovery cause
- errdisable recovery interval
- flowcontrol
- interface
- interface group
- interface loopback
- interface managementEthernet
- interface null
- interface range
- interface range macro (define)
- interface range macro name
- interface vlan
- intf-type cr4 autoneg
- keepalive
- monitor interface
- mtu
- negotiation auto
- no port-delay-restore (Interface Mode)
- port-delay-restore (Configuration Mode)
- portmode hybrid
- rate-interval
- rate-interval (Configuration Mode)
- show config
- show config (from INTERFACE RANGE mode)
- show interfaces
- show interfaces configured
- show interfaces dampening
- show interfaces phy
- show interfaces stack-unit
- show interfaces status
- show interfaces switchport
- show interfaces transceiver
- show interfaces vlan
- show range
- show running-config ecmp-group
- show system stack-unit fanout configured
- shutdown
- speed (for 10/100/1000/10000 interfaces)
- speed (Management interface)
- stack-unit portmode quad
- switchport
- wavelength
- Egress Interface Selection (EIS) Commands
- Port Channel Commands
- Time Domain Reflectometer (TDR) Commands
- UDP Broadcast Commands
- ip http source-interface
- Basic Interface Commands
- Internet Protocol Security (IPSec)
- IPv4 Routing
- arp
- arp backoff-time
- arp learn-enable
- arp max-entries
- arp retries
- arp timeout
- clear arp-cache
- clear host
- clear ip fib stack-unit
- clear ip route
- clear tcp statistics
- debug arp
- debug ip dhcp
- debug ipv6 dhcp
- debug ip icmp
- debug ip packet
- icmp6-redirect enable
- ip address
- ip directed-broadcast
- ip domain-list
- ip domain-lookup
- ip domain-name
- ip helper-address
- ip helper-address hop-count disable
- ip host
- ip icmp source-interface
- ipv6 icmp source-interface
- ip max-frag-count
- ip max-routes
- ip name-server
- ip proxy-arp
- ip route
- ip source-route
- ip unreachables
- load-balance
- load-balance hg
- management route
- show arp
- show arp retries
- show hosts
- show ip cam stack-unit
- show ip fib stack-unit
- show ip flow
- show ip interface
- show ip management-route
- show ipv6 management-route
- show ip protocols
- show ip route
- show ip route list
- show ip route summary
- show ip traffic
- show tcp statistics
- IPv6 Access Control Lists (IPv6 ACLs)
- IPv6 Basics
- cam-ipv6 extended-prefix
- clear ipv6 fib
- clear ipv6 route
- clear ipv6 mld_host
- maximum dynamic-routes-ipv6
- ipv6 address autoconfig
- ipv6 address
- ipv6 address eui64
- ipv6 control-plane icmp error-rate-limit
- ipv6 flowlabel-zero
- ipv6 host
- ipv6 name-server
- ipv6 nd dad attempts
- ipv6 nd disable-reachable-timer
- ipv6 nd dns-server
- ipv6 nd prefix
- ipv6 nd reachable-time
- ipv6 route
- ipv6 unicast-routing
- show ipv6 cam stack-unit
- show ipv6 control-plane icmp
- show ipv6 fib stack-unit
- show ipv6 flowlabel-zero
- show ipv6 interface
- show ipv6 mld_host
- show ipv6 route
- trust ipv6-diffserv
- iSCSI Optimization
- Intermediate System to Intermediate System (IS-IS)
- adjacency-check
- advertise
- area-password
- clear config
- clear isis
- clns host
- debug isis
- debug isis adj-packets
- debug isis local-updates
- debug isis snp-packets
- debug isis spf-triggers
- debug isis update-packets
- default-information originate
- description
- distance
- distribute-list in
- distribute-list out
- distribute-list redistributed-override
- domain-password
- graceful-restart ietf
- graceful-restart interval
- graceful-restart restart-wait
- graceful-restart t1
- graceful-restart t2
- graceful-restart t3
- hello padding
- hostname dynamic
- ignore-lsp-errors
- ip router isis
- ipv6 router isis
- isis circuit-type
- isis csnp-interval
- isis hello-interval
- isis hello-multiplier
- isis hello padding
- isis ipv6 metric
- isis metric
- isis network point-to-point
- isis password
- isis priority
- is-type
- log-adjacency-changes
- lsp-gen-interval
- lsp-mtu
- lsp-refresh-interval
- max-area-addresses
- max-lsp-lifetime
- maximum-paths
- metric-style
- multi-topology
- net
- passive-interface
- redistribute
- redistribute bgp
- redistribute ospf
- router isis
- set-overload-bit
- show config
- show isis database
- show isis graceful-restart detail
- show isis hostname
- show isis interface
- show isis neighbors
- show isis protocol
- show isis traffic
- spf-interval
- Link Aggregation Control Protocol (LACP)
- Layer 2
- MAC Addressing Commands
- clear mac-address-table
- mac-address-table aging-time
- mac-address-table disable-learning
- mac-address-table static
- mac-address-table station-move threshold
- mac-address-table station-move refresh-arp
- mac learning-limit
- mac learning-limit learn-limit-violation
- mac learning-limit mac-address-sticky
- mac learning-limit station-move-violation
- mac learning-limit reset
- mac port-security
- show cam mac linecard (count)
- show cam mac linecard (dynamic or static)
- show mac-address-table
- show mac-address-table aging-time
- show mac accounting destination
- show mac learning-limit
- Virtual LAN (VLAN) Commands
- Far-End Failure Detection (FEFD)
- MAC Addressing Commands
- Link Layer Discovery Protocol (LLDP)
- LLPD Commands
- advertise dot1-tlv
- advertise dot3-tlv
- advertise interface-port-desc
- advertise management-tlv
- advertise management-tlv (Interface)
- clear lldp counters
- clear lldp neighbors
- debug lldp interface
- disable
- hello
- management-interface
- mode
- multiplier
- protocol lldp (Configuration)
- protocol lldp (Interface)
- show lldp neighbors
- show lldp statistics
- show management-interface
- show running-config lldp
- snmp-notification-interval
- LLDP-MED Commands
- LLPD Commands
- Microsoft Network Load Balancing
- Multicast Source Discovery Protocol (MSDP)
- clear ip msdp peer
- clear ip msdp sa-cache
- clear ip msdp statistic
- debug ip msdp
- ip msdp cache-rejected-sa
- ip msdp default-peer
- ip msdp log-adjacency-changes
- ip msdp mesh-group
- ip msdp originator-id
- ip msdp peer
- ip msdp redistribute
- ip msdp sa-filter
- ip msdp sa-limit
- ip msdp shutdown
- ip multicast-msdp
- show ip msdp
- show ip msdp sa-cache rejected-sa
- Multicast Listener Discovery Protocol
- Multiple Spanning Tree Protocol (MSTP)
- Multicast
- Neighbor Discovery Protocol (NDP)
- Object Tracking
- Open Shortest Path First (OSPFv2 and OSPFv3)
- OSPFv2 Commands
- area default-cost
- area nssa
- area range
- area stub
- auto-cost
- clear ip ospf
- clear ip ospf statistics
- debug ip ospf
- default-information originate
- default-metric
- description
- distance
- distance ospf
- distribute-list in
- distribute-list out
- fast-convergence
- graceful-restart grace-period
- graceful-restart helper-reject
- graceful-restart mode
- graceful-restart role
- ip ospf auth-change-wait-time
- ip ospf authentication-key
- ip ospf cost
- ip ospf dead-interval
- ip ospf hello-interval
- ip ospf message-digest-key
- ip ospf mtu-ignore
- ip ospf network
- ip ospf priority
- ip ospf retransmit-interval
- ip ospf transmit-delay
- log-adjacency-changes
- maximum-paths
- network area
- passive-interface
- redistribute
- redistribute bgp
- redistribute isis
- router-id
- router ospf
- show config
- show ip ospf
- show ip ospf asbr
- show ip ospf database
- show ip ospf database asbr-summary
- show ip ospf database external
- show ip ospf database network
- show ip ospf database nssa-external
- show ip ospf database opaque-area
- show ip ospf database opaque-as
- show ip ospf database opaque-link
- show ip ospf database router
- show ip ospf database summary
- show ip ospf interface
- show ip ospf neighbor
- show ip ospf routes
- show ip ospf statistics
- show ip ospf timers rate-limit
- show ip ospf topology
- summary-address
- timers spf
- timers throttle lsa all
- timers throttle lsa arrival
- OSPFv3 Commands
- area authentication
- area encryption
- area nssa
- auto-cost
- clear ipv6 ospf process
- debug ipv6 ospf bfd
- debug ipv6 ospf events
- debug ipv6 ospf packet
- debug ipv6 ospf spf
- default-information originate
- graceful-restart grace-period
- graceful-restart mode
- ipv6 ospf area
- ipv6 ospf authentication
- ipv6 ospf bfd all-neighbors
- ipv6 ospf cost
- ipv6 ospf dead-interval
- ipv6 ospf encryption
- ipv6 ospf graceful-restart helper-reject
- ipv6 ospf hello-interval
- ipv6 ospf mtu-ignore
- ipv6 ospf priority
- ipv6 router ospf
- maximum-paths
- passive-interface
- redistribute
- router-id
- show crypto ipsec policy
- show crypto ipsec sa ipv6
- show ipv6 ospf database
- show ipv6 ospf interface
- show ipv6 ospf neighbor
- timers spf
- OSPFv2 Commands
- Policy-based Routing (PBR)
- PIM-Sparse Mode (PIM-SM)
- IPv4 PIM-Sparse Mode Commands
- clear ip pim rp-mapping
- clear ip pim tib
- debug ip pim
- ip pim bsr-border
- ip pim bsr-candidate
- ip pim dr-priority
- ip pim join-filter
- ip pim ingress-interface-map
- ip pim neighbor-filter
- ip pim query-interval
- ip pim register-filter
- ip pim rp-address
- ip pim rp-candidate
- ip pim sparse-mode
- ip pim sparse-mode sg-expiry-timer
- ip pim ssm-range
- ip pim spt-threshold
- no ip pim snooping dr-flood
- show ip pim bsr-router
- show ip pim interface
- show ip pim neighbor
- show ip pim rp
- show ip pim snooping interface
- show ip pim snooping neighbor
- show ip pim snooping tib
- show ip pim ssm-range
- show ip pim summary
- show ip pim tib
- show running-config pim
- IPv6 PIM-Sparse Mode Commands
- clear ipv6 pim tib
- debug ipv6 pim
- ipv6 pim bsr-border
- ipv6 pim bsr-candidate
- ipv6 pim dr-priority
- ipv6 pim query-interval
- ipv6 pim rp-address
- ipv6 pim rp-candidate
- ipv6 pim sparse-mode
- ipv6 pim sparse-mode sg-expiry-timer
- ipv6 pim spt-threshold
- show ipv6 pim bsr-router
- show ipv6 pim interface
- show ipv6 pim neighbor
- show ipv6 pim rp
- show ipv6 pim summary
- show ipv6 pim tib
- IPv4 PIM-Sparse Mode Commands
- Port Monitoring
- Private VLAN (PVLAN)
- Per-VLAN Spanning Tree Plus (PVST+)
- Quality of Service (QoS)
- Global Configuration Commands
- Per-Port QoS Commands
- Policy-Based QoS Commands
- bandwidth-percentage
- class-map
- clear qos statistics
- description
- match ip access-group
- match ip dscp
- match ip precedence
- match ip vlan
- match ip vrf
- match mac access-group
- match mac dot1p
- match mac vlan
- policy-aggregate
- policy-map-input
- policy-map-output
- qos-policy-input
- qos-policy-output
- queue egress
- queue ingress
- rate-police
- rate-shape
- service-policy input
- service-policy output
- service-queue
- set
- show qos class-map
- show qos dot1p-queue-mapping
- show qos policy-map
- show qos policy-map-input
- show qos policy-map-output
- show qos qos-policy-input
- show qos qos-policy-output
- show qos statistics
- show qos wred-profile
- test cam-usage
- threshold
- trust
- wred
- wred ecn
- wred-profile
- DSCP Color Map Commands
- Routing Information Protocol (RIP)
- auto-summary
- clear ip rip
- debug ip rip
- default-information originate
- default-metric
- description
- distance
- distribute-list in
- distribute-list out
- ip poison-reverse
- ip rip receive version
- ip rip send version
- ip split-horizon
- maximum-paths
- neighbor
- network
- offset-list
- output-delay
- passive-interface
- redistribute
- redistribute isis
- redistribute ospf
- router rip
- show config
- show ip rip database
- show running-config rip
- timers basic
- version
- Remote Monitoring (RMON)
- Rapid Spanning Tree Protocol (RSTP)
- Software-Defined Networking (SDN)
- Security
- AAA Accounting Commands
- Authorization and Privilege Commands
- Obscure Password Commands
- Authentication and Password Commands
- RADIUS Commands
- aaa radius auth-method
- client
- client-key
- coa-bounce-port
- coa-disable-port
- coa-reauthenticate
- debug radius
- da-rsp-timeout
- disconnect-user
- dynamic-auth-enable
- ip radius source-interface
- port
- radius dynamic-auth
- radius-server deadtime
- radius-server group
- radius-server host
- radius-server vrf
- radius-server key
- radius-server retransmit
- radius-server timeout
- rate-limit
- replay-protection-window
- terminate-session
- TACACS+ Commands
- Port Authentication (802.1X) Commands
- dot1x authentication (Configuration)
- dot1x authentication (Interface)
- dot1x auth-fail-vlan
- dot1x auth-server
- dot1x guest-vlan
- dot1x mac-auth-bypass
- dot1x max-eap-req
- dot1x port-control
- dot1x quiet-period
- dot1x reauthentication
- dot1x reauth-max
- dot1x server-timeout
- dot1x supplicant-timeout
- dot1x tx-period
- show dot1x interface
- SSH and SCP Commands
- crypto key generate
- crypto key zeroize rsa
- debug ip ssh
- ip scp topdir
- ip ssh authentication-retries
- ip ssh challenge–response–authentication
- ip ssh cipher
- ip ssh connection-rate-limit
- ip ssh hostbased-authentication
- ip ssh key-size
- ip ssh mac
- ip ssh password-authentication
- ip ssh pub-key-file
- ip ssh rekey
- ip ssh rhostsfile
- ip ssh rsa-authentication (Config)
- ip ssh server
- ip ssh server dns enable
- ip ssh server vrf
- ip ssh source-interface
- ip ssh vrf
- show crypto
- show ip ssh
- show ip ssh client-pub-keys
- show ip ssh rsa-authentication
- ssh
- Secure DHCP Commands
- Role-Based Access Control Commands
- System Security Commands
- Service Provider Bridging
- sFlow
- Simple Network Management Protocol (SNMP) and Syslog
- SNMP Commands
- show snmp
- show snmp engineID
- show snmp group
- show snmp supported-mibs
- show snmp supported-traps
- show snmp user
- snmp context
- snmp ifmib ifalias long
- snmp-server community
- snmp-server contact
- snmp-server enable traps
- snmp-server engineID
- snmp-server group
- snmp-server host
- snmp-server location
- snmp-server packetsize
- snmp-server trap-source
- snmp-server user
- snmp-server user (for AES128-CFB Encryption)
- snmp-server view
- snmp-server vrf
- snmp trap link-status
- Syslog Commands
- clear logging
- clear logging auditlog
- default logging buffered
- default logging console
- default logging monitor
- default logging trap
- logging
- logging buffered
- logging console
- logging extended
- logging facility
- logging history
- logging history size
- logging monitor
- logging on
- logging source-interface
- logging synchronous
- logging trap
- logging version
- show logging
- show logging auditlog
- show logging driverlog stack-unit
- terminal monitor
- SNMP Commands
- SNMP Traps
- Stacking
- Storm Control
- show storm-control broadcast
- show storm-control multicast
- show storm-control unknown-unicast
- storm-control broadcast (Configuration)
- storm-control broadcast (Interface)
- storm-control multicast (Configuration)
- storm-control multicast (Interface)
- storm-control PFC/LLFC
- storm-control unknown-unicast (Configuration)
- storm-control unknown-unicast (Interface)
- Spanning Tree Protocol (STP)
- SupportAssist
- System Time and Date
- clock summer-time date
- clock summer-time recurring
- clock timezone
- debug ntp
- ntp authenticate
- ntp authentication-key
- ntp broadcast client
- ntp control-key-passwd
- ntp disable
- ntp master
- ntp offset-threshold
- ntp server
- ntp source
- ntp step-threshold
- ntp trusted-key
- show clock
- show ntp associations
- show ntp vrf associations
- show ntp status
- Tunneling
- Uplink Failure Detection (UFD)
- VLAN Stacking
- Virtual Routing and Forwarding (VRF)
- VLT Proxy Gateway
- Virtual Link Trunking (VLT)
- back-up destination
- clear vlt statistics
- delay-restore
- delay-restore abort-threshold
- lacp ungroup member-independent
- multicast peer-routing timeout
- peer-link port-channel
- peer-routing
- peer-routing-timeout
- primary-priority
- show vlt brief
- show vlt backup-link
- show vlt counters
- show vlt detail
- show vlt inconsistency
- show vlt mismatch
- show vlt role
- show vlt statistics
- show vlt statistics igmp-snoop
- system-mac
- unit-id
- vlt domain
- vlt-peer-lag port-channel
- show vlt private-vlan
- Virtual Extensible LAN (VXLAN)
- clear mac-address-table dynamic
- clear vxlan vxlan-instance statistics
- controller
- feature vxlan
- debug vxlan
- disable-mac-learn
- fail-mode
- gateway-ip
- local-vtep-ip
- max_backoff
- peer-ovsdbserver-ip
- remote-vtep-ip
- vnid
- vni-profile
- vxlan-instance
- vxlan-instance (VAP)
- vxlan-instance loopback
- vnid
- vni-profile
- vxlan-instance static
- vxlan-vnid
- show running-config vxlan
- show vxlan vxlan-instance
- show vxlan vxlan-instance logical network
- show vxlan vxlan-instance physical-locator
- show vxlan vxlan-instance statistics interface
- show vxlan vxlan-instance statistics remote-vtep-ip
- show vxlan vxlan-instance unicast-mac-local
- show vxlan vxlan-instance unicast-mac-remote
- show vxlan vxlan-instance vtep-vni-map
- Virtual Router Redundancy Protocol (VRRP)
- X.509v3

Version Description
7.7.1.1 Introduced on the S-Series.
7.5.1.0 Introduced on the C-Series.
6.1.1.1 Introduced on the E-Series.
Example of
show qos
statistics
egress—queue
with per queue
per port tx and
drop rates
Example of
show qos
statistics
wred-profile
DellEMC(conf)#do show qos statistics wred-profile
Global Wred State : Enabled
Interface Te 1/11
Drop-statistic Dropped Pkts
Green 0
Yellow 6730113
Out of Profile 0
Usage
Information
In a dual homing setup, you can use this command only from the primary VLT peer.
The following list describes output of the show qos statistics command in the example:
● Queue # — Queue Number.
● Queued Bytes — Snapshot of the byte count in that queue.
● Queued Pkts — Cumulative packet count in that queue.
● Matched Pkts — The number of packets that matched the class-map criteria.
NOTE: When you configure trust , matched packet counters are not incremented in this field.
● Matched Bytes — The number of bytes that matched the class-map criteria.
NOTE: When you configure trust , matched byte counters are not incremented in this field.
● Dropped Pkts — The total of the number of packets dropped for green, yellow and out-of-profile.
show qos wred-profile
View the WRED profile details.
Syntax
show qos wred-profile wred-profile-name
Parameters
wred-profile-
name
Enter the WRED profile name to view the profile details.
Defaults none
Command Modes
● EXEC
● EXEC Privilege
Command
History
This guide is platform-specific. For command information about other platforms, see the relevant Dell
EMC Networking OS Command Line Reference Guide.
Version Description
9.12(0.0) Modified to display the global WRED state.
9.10(0.1) Introduced on the S6010-ON and S4048T-ON.
9.10(0.0) Introduced on the S3148.
9.10(0.0) Introduced on the S6100-ON.
1330 Quality of Service (QoS)