
User's Manual
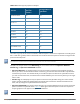


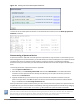

Graph Title Description
Update
Interval
Active Devices
Table
A pie chart showing the percentages and total numbers of each
device type for all active devices. This graph has no set update
interval; the graph automatically updates when values change.
For details, see Active Devices on page 714.
N/A
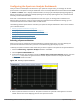
Active Devices
Trend
A line chart showing the numbers of up to five different types of
Wi-Fi and non-Wi-Fi devices seen on selected channels during a
specified time interval. This chart can show devices on multiple
channels for a spectrum monitor, or the single monitored
channel for a hybrid AP. For details, see Active Devices Trend on
page 718.
5 seconds
Channel
Metrics
This stacked bar chart shows the current relative quality,
availability or utilization of selected channels in the 2.4 GHz or 5
GHz radio bands. This chart can show multiple channels for a
spectrum monitor, or the single monitored channel for a hybrid
AP. For details, see Channel Metrics on page 719.
5 seconds
Channel
Metrics Trend
A line chart showing the relative quality or availability of selected
channels in the 2.4 GHz or 5 GHz radio bands over a specified
time interval. Spectrum monitors can show channel data for
multiple channels, while a hybrid AP shows information only for
its one monitored channel. For details, see Channel Metrics
Trend on page 721.
5 seconds
Channel
Summary
Table
The Channel Summary table displays the number of devices
found on each channel in the spectrum monitor’s radio band, the
percentage of channel utilization, and AP power and interference
levels. Spectrum monitors can show data for multiple channels,
while a hybrid AP shows a channel summary only for its one
monitored channel. For details, see Channel Summary Table on
page 723.
5 seconds
Channel
Utilization
Trend
A line chart that shows the channel utilization for one or more
radio channels, as measured over a defined time interval.
Spectrum monitors can show data for multiple channels, while a
hybrid AP shows utilization levels for its one monitored channel
only. For details, see Channel Utilization Trend on page 726.
5 seconds
Device Duty
Cycle
A stacked bar chart showing the percent of each channel in the
spectrum monitor radio’s frequency band used by a Wi-Fi AP or
any other device type detected by the spectrum monitor. The
Device Duty Cycle chart for a hybrid AP only shows data for the
one channel monitored by the hybrid AP.This chart is not
available for W-AP68 access points. For details, see Device Duty
Cycle on page 724.
5 seconds
Devices vs
Channel
A stacked bar chart showing the total numbers of each device
type detected on each channel in the spectrum monitor radio’s
frequency band. The Devices vs Channel chart for a hybrid AP
only shows data for the one channel monitored by the hybrid AP.
For details, see Devices vs Channel on page 727.
5 seconds
Table 133: Spectrum Analysis Graphs
Dell Networking W-Series ArubaOS 6.4.x | User Guide Spectrum Analysis | 702