
User's Manual


703 | Spectrum Analysis Dell Networking W-Series ArubaOS 6.4.x| User Guide
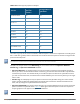
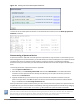
Graph Title Description
Update
Interval
FFT Duty Cycle Fast Fourier Transform, or FFT, is an algorithm for computing the
frequency spectrum of a time-varying input signal. This line chart
shows the FFT duty cycle, which represents the percent of time a
signal is broadcast on the specified channel or frequency.
Spectrum monitors can show data for multiple channels, while a
hybrid AP shows information only for its one monitored channel.
This chart is not available for W-AP68 access points. For details,
see FFT Duty Cycle on page 729.
1 second
Interference
Power
This chart shows information about Wi-Fi interference, including
the Wi-Fi noise floor, and the amount of adjacent channel
interference from cordless phones, bluetooth devices and
microwaves. Spectrum monitors can show interference power
data for multiple channels, while a hybrid AP shows information
only for its one monitored channel. For details, see Interference
Power on page 731.
5 seconds
Quality
Spectrogram
This plot shows quality statistics for selected range of channels
or frequencies as determined by the current noise floor, non-Wi-
Fi (interferer) utilization and duty-cycles and certain types of
retries. This chart can also be configured to show channel
availability, the percentage of each channel that is unused and
available for additional traffic. Spectrum monitors can show data
for multiple channels, while a hybrid AP shows information only
for its one monitored channel. For details, see Quality
Spectrogram on page 733.
5 seconds
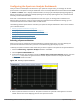
Real-Time FFT Fast Fourier Transform, or FFT, is an algorithm for computing the
frequency spectrum of a time-varying input signal. This line chart
shows the power level of a signal on the channels or frequencies
monitored by a spectrum monitor radio. Spectrum monitors can
show data for multiple channels, while a hybrid AP shows
information only for its one monitored channel.
This chart is not available for W-AP68 access points. For details,
see Real-Time FFT on page 734.
1 second
Swept
Spectrogram
This plot displays FFT power levels For details, see or the FFT duty
cycle for a selected channel or frequency, as measured during
each time tick. Spectrum monitors can show data for multiple
channels, while a hybrid AP shows information only for its one
monitored channel.
This chart is not available for W-AP68 access points. For details,
see Swept Spectrogram on page 736.
1 second
Spectrum Analysis Clients
The maximum number of spectrum monitor radios and hybrid AP radios on a controller is limited only by the
number of APs on that controller. If desired, you can configure every radio on an AP that supports the
Spectrum Analysis feature as a spectrum device. A dual-radio AP can operate as two spectrum devices, because
each radio can be individually configured as a spectrum monitor (SM) or hybrid AP.
A spectrum analysis client can simultaneously access data from up to four individual spectrum device radios.
Each spectrum device radio, however, can only be connected to a single client WebUI.
When you select a specific spectrum monitor or hybrid AP radio to stream data to your client, the controller
first verifies the device is not subscribed to some other client. Once the SM or hybrid AP radio has been verified
as available, the SM or hybrid AP establishes a connection to the client and begins sending spectrum analysis