
User's Manual


Configuring the Spectrum Analysis Dashboards
Once you have connected spectrum monitors to your spectrum analysis client, you can begin to monitor
spectrum data in the spectrum analysis dashboards. There are three predefined sets of dashboard views, View
1, View 2 and View 3. View 1 displays the Real-Time FFT, FFT Duty-Cycle and Swept Spectrogram graphs by
default, and Views 2 and 3 display the Swept Spectrogram and Quality Spectrogram charts, and the Channel
Summary and Active Devices tables.
Each chart in the dashboard can be replaced with other chart types, or reconfigured to show data for a
different spectrum monitor. Once you have configured a dashboard view with different settings, you can
rename that dashboard view to better reflect its new content.
The following sections explain how to customize your Spectrum Analysis dashboard to best suit the needs of
your individual network:
l Selecting a Spectrum Monitor on page 710
l Changing Graphs within a Spectrum View on page 711
l Renaming a Spectrum Analysis Dashboard View on page 711
l Saving a Dashboard View on page 712
l Resizing an Individual Graph on page 713
Selecting a Spectrum Monitor
When you first log into the Spectrum Analysis dashboard, it displays blank charts. You must identify the
spectrum monitor whose information you want to view before the graphs display any data.
To identify the spectrum monitor radio whose data you want to appear in the Spectrum Analysis dashboard:
1. Access the Monitoring > Spectrum Analysis window in the WebUI.
2. Click the Spectrum Dashboards tab.
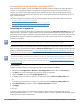
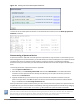
3. In the graph title bar, click the down arrow by the Please select a spectrum monitor heading, as shown
in Figure 102. A drop-down list appears with the name of all spectrum monitor and hybrid AP radios
currently connected to the client.
Figure 102 Selecting a Spectrum Monitor
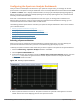
4. Select a spectrum monitor from the list. The spectrum monitor or hybrid AP name appears in the chart
titlebar and the chart starts displaying data for that spectrum monitor.
Dell Networking W-Series ArubaOS 6.4.x | User Guide Spectrum Analysis | 710